FIG 5.
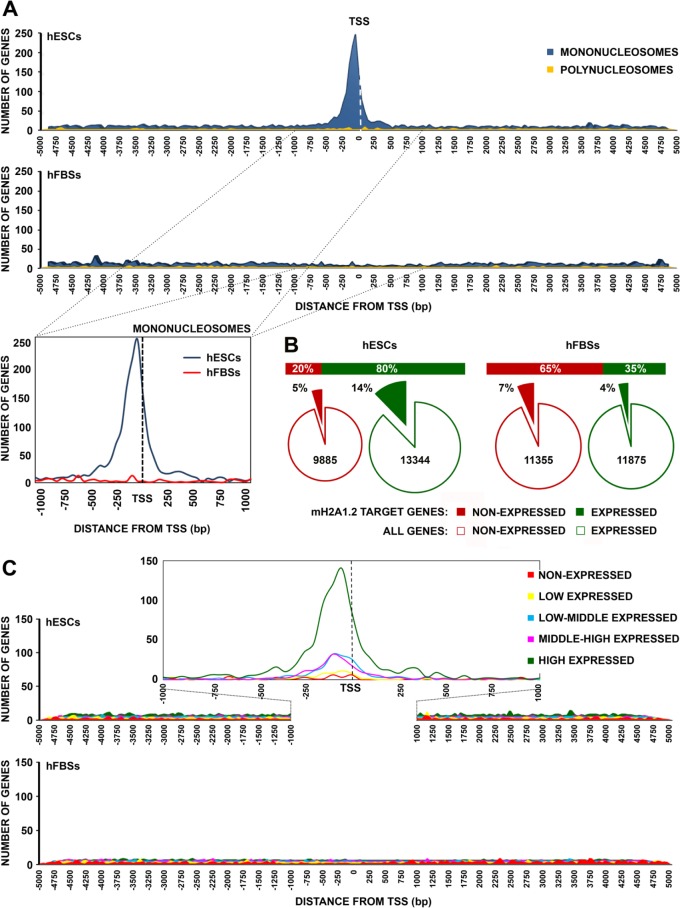
mH2A1.2 nucleosomes are enriched at the promoters of expressed genes in hESCs. (A) (Top) Distribution of mH2A1.2 mononucleosomes and polynucleosomes in the region spanning 5 kb on either side of the TSS of target genes in human ESCs and human FBSs. (Bottom) Distribution of mH2A1.2 mononucleosomes in the region spanning 1 kb on either side of the TSS of target genes in human ESCs and human fibroblasts. (B) (Top) Graph showing the categorization of mH2A1.2 target genes (within 5 kb on either side of TSS) as expressed or nonexpressed genes in human ESCs and human FBSs. (Bottom) Pie charts depicting the percentages of the nonexpressed mH2A1.2 target genes as a fraction of the total number of nonexpressed genes (red line). Similarly, the fractions of expressed mH2A1.2 target genes are depicted compared to the total number of expressed genes (green line). (C) mH2A1.2 is preferentially located at the promoters of active genes in hESCs. mH2A1.2 ChIP aggregated enrichment profiles around TSS in hESCs (top) and hFBSs (bottom). All expressed genes were identified by RNA-seq and divided into five groups according to their expression levels. Each line represents the average number of reads per transcript plotted relative to the TSS for each expression group. At the top is an enlargement of the region within 1 kb on either side of the TSS of all mH2A1.2 targets in hESCs. mH2A1.2 is depleted from the promoters of all expression categories in hFBSs (bottom).

