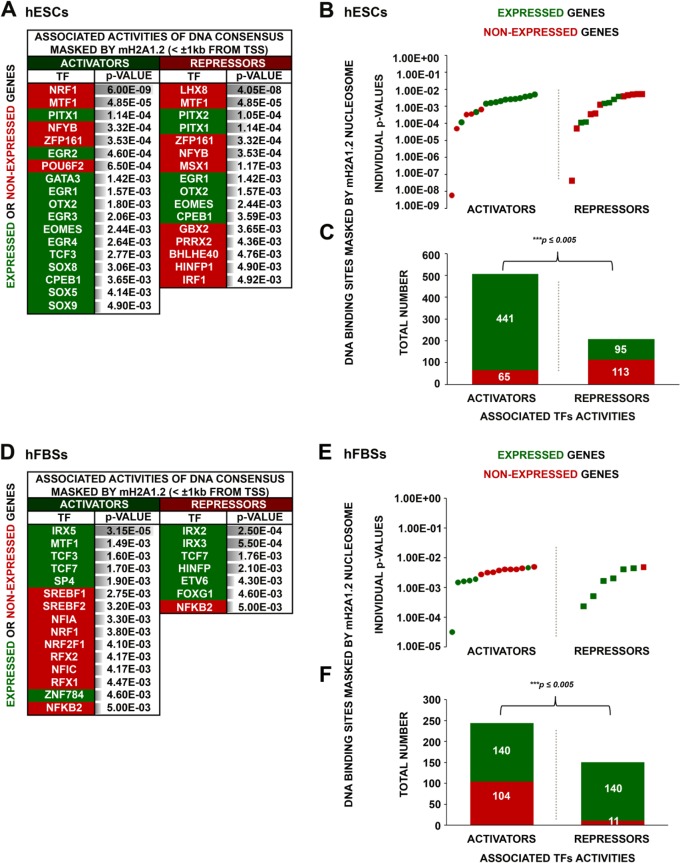
FIG 7.
Distinct transcriptional-regulatory elements are masked by mH2A1.2 nucleosomes in hESCs and hFBSs. (A) Main TF DNA binding consensus motifs corresponding to either activators or repressors identified within the footprint of the mH2A1.2 mononucleosomes for expressed or nonexpressed genes in hESCs. The relative enrichment (P value) for each predicted motif is shown. (B) Scatterplot depicting the probabilities calculated for each predicted motif (individual P values) corresponding to activators or repressors found in either expressed or nonexpressed genes in hESCs. (C) Sums of all activator and repressor putative DNA binding sites masked by mH2A1.2 mononucleosomes in expressed and nonexpressed genes in hESCs illustrating a higher proportion of activator masking sites in expressed genes. (D) Same as panel A, but for hFBSs. (E) Same as panel B, but for hFBSs. (F) Same as panel C, but for hFBSs, except that in hFBSs a higher proportion of repressor binding sites are masked in expressed genes.

