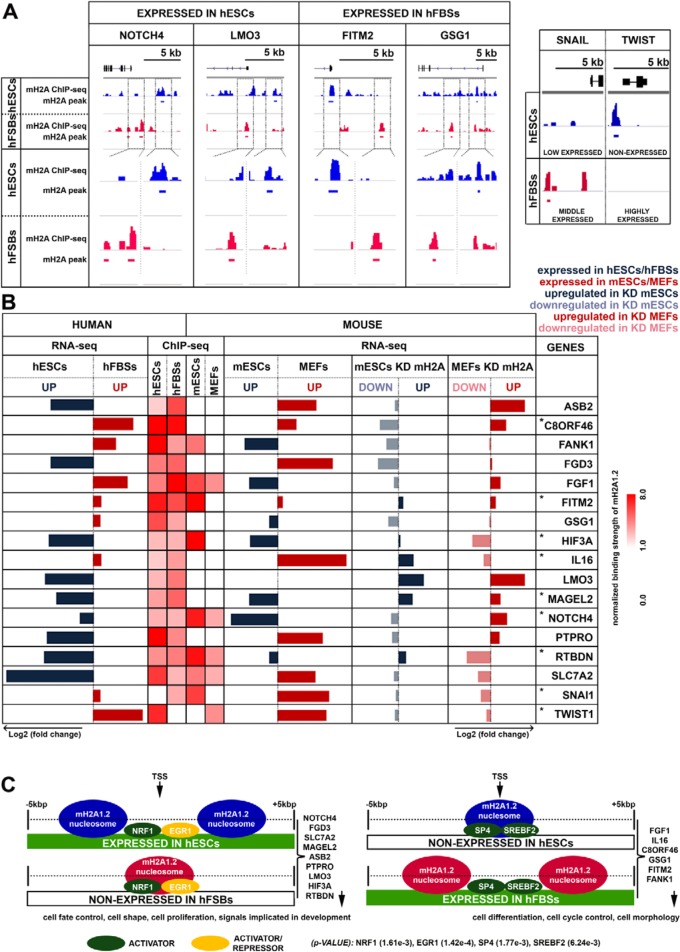
FIG 8.
mH2A1.2 nucleosomes occupy the promoters of a specific set of genes and direct opposite expression programs in hESCs and hFBSs. (A) Snapshots of ChIP-seq profiles (IGV) of genes bound by mH2A1.2 depicting the distinct nucleosome positioning in hESCs (blue track) and hFBSs (red track) (compare top and bottom views for each corresponding region). The ChIP-seq profiles of the key MET regulators, SNAI1 and TWIST1, are shown on the right. The gene models (black) depict exons as boxes and introns as lines. (B) Comparison of the expression levels of the commonly bound mH2A1.2 target genes and the key regulators of MET (SNAI1 and TWIST1 [bottom]) as determined by RNA-seq in hESCs and hFBSs. The heat map (right) displays the ChIP-seq data for mH2A1.2 nucleosomes (within 5 kb on either side of the TSS) of the common target genes with opposite expression patterns in hESCs and hFBSs and the corresponding analysis of the same genes in mESCs and MEFs. The right part of the table displays our RNA-seq analysis in WT mESCs and MEFs, as well as in mH2A1.2-KD mESCs and MEFs. The asterisks denote genes with similar expression patterns in both hESCs/mESCs and in hFBSs/MEFs. (C) Relative positioning of mH2A1.2 nucleosomes in the region within 5 kb on either side of the TSS of the common target genes in hESCs and hFBSs that are differentially expressed in these cell types.

