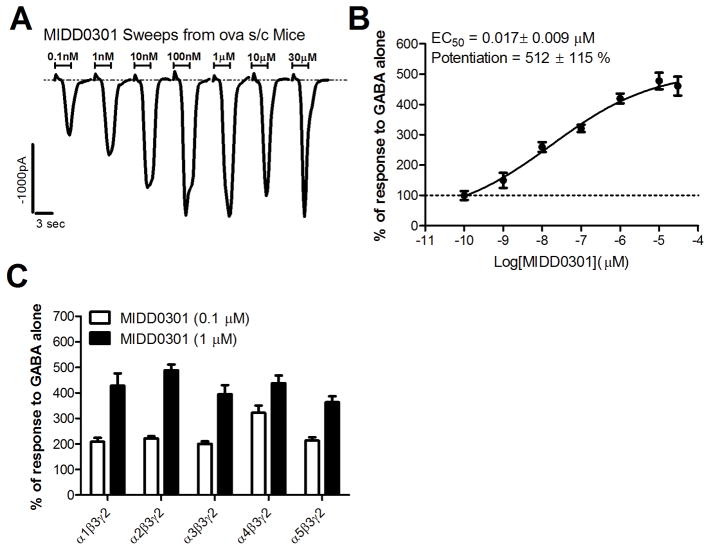
Figure 5.
Induced electrophysiological responses by MIDD0301. A) Current responses of CD4+ T lymphocytes isolated from ova s/c mice (n = 12) in the presence of 600 nM GABA and increasing concentration of MIDD0301 applied for 3 seconds, as determined by automated patch clamp. B) Normalized current responses of isolated CD4+ T lymphocytes (ova s/c mice) in the presence of 600 nM GABA (100 %) and increasing concentrations of MIDD03101 for eight independent measurements with an n = 12. Data was fitted to a Y=Bottom + (Top-Bottom)/(1+10^((LogIC50-X)*HillSlope)) to determine EC50 and top of the curve (potentiation); C) Average enhancement of current evoked to GABA by 0.1 μM or 1 μM of MIDD0301 using transiently transfected cells with α GABAAR subunits, as indicated, along with β3 and γ2L subunits measured by patch clamp. Data represent mean ± SEM with an n = 5.

