FIG 3 .
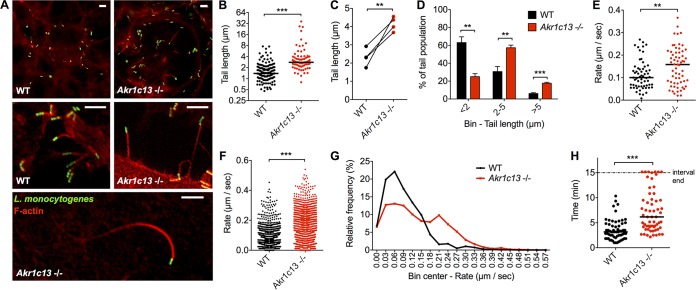
L. monocytogenes actin tail lengths and rates of movement are augmented in RECON-deficient hepatocytes. (A) Images of L. monocytogenes cells (green) associated with F-actin (red) in TIB73 cells at 8 hpi. Scale bars, 5 µm. (B) Quantification of L. monocytogenes actin tail lengths in WT or Akr1c13−/− TIB73 hepatocytes. (C) Data from the same experiment shown in panel B for the mean tail lengths, measured from 4 independent experiments each with 75 to 150 tails quantified. (D) Data from panel C were plotted as binned (<2, 2 to 5, or >5 µm) tail lengths. (E) Average movement rates of L. monocytogenes in TIB73 cells at 6 to 8 hpi. Each data point represents an individual bacterium. Images were captured every 10 s and averaged across at least 6 frames. At least 60 bacteria were measured for each infected cell type. (F and G) Compilation of all L. monocytogenes rates from the individual bacteria measured in panel E. Data are plotted as unbinned (F) or binned (G). (H) Lengths of time individual bacteria (n = 60) were associated with their actin tails across 15-min time intervals. (A to H) L. monocytogenes actin tail lengths were measured at 6 to 8 hpi. Median values are indicated by bars. (B, C, and E to G) All data points across multiple experiments are plotted together. **, P ≤ 0.001; ***, P ≤ 0.0001.

