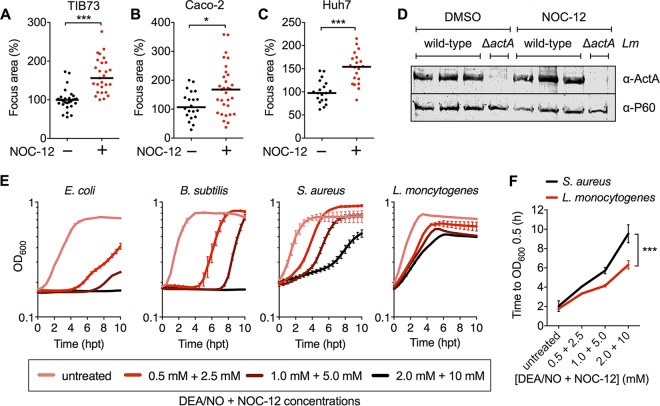
FIG 6 .
L. monocytogenes cell-to-cell spread is generally enhanced by nitric oxide in nonphagocytic cells. (A to C) Focus areas of L. monocytogenes in WT TIB73 (A), Caco-2 (B), or Huh7 (C) cells treated with the nitric oxide donor NOC-12. (D) Western blot of L. monocytogenes ActA and P60 (loading control) proteins expressed at 5 hpi in Huh7 cells plus or minus treatment with NOC-12, performed in biological triplicates. (E) Growth (OD600 values) of Escherichia coli, Bacillus subtilis, Staphylococcus aureus, or Listeria monocytogenes in TSB containing the indicated concentrations of the nitric oxide donors DEA/NO and NOC-12. n = 3. Error bars represent SD. (F) Results of the same experiment shown in panel D, with growth times plotted (hours) to reach the indicated OD600 in the presence of increasing concentrations of DEA/NO and NOC-12. In panels A to C, median values are indicated by bars. All foci measured at 8 hpi are shown and were plotted as the percentage of wild-type L. monocytogenes in untreated WT cells. All data are representative of two independent experiments, except in panel D, where three biological replicates are shown together. *, P ≤ 0.05; ***, P ≤ 0.0001.

