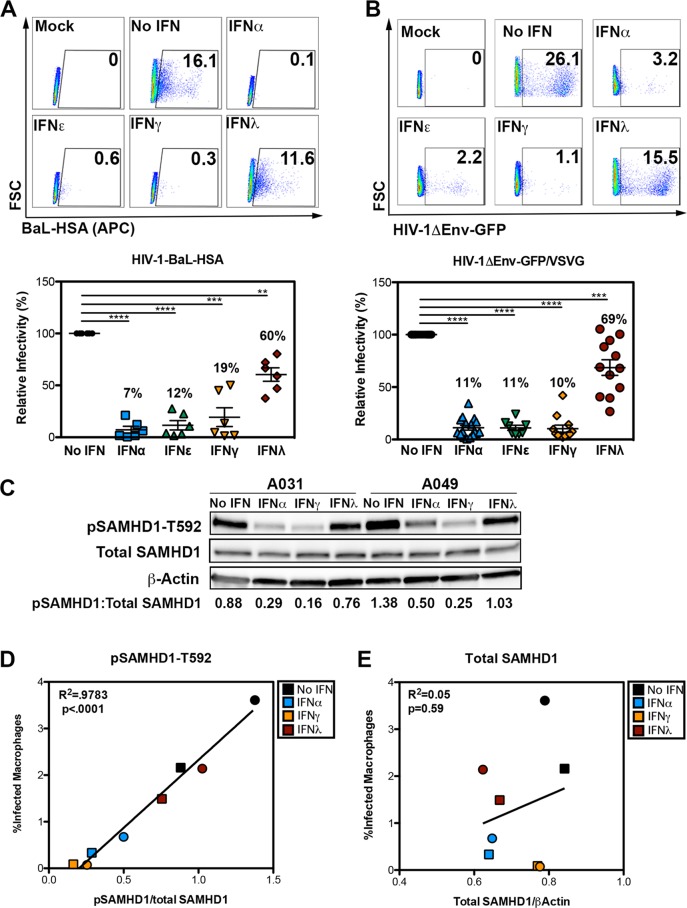
FIG 1 .
Diverse IFNs restrict HIV-1 in MDM and induce SAMHD1 dephosphorylation. (A and B) Flow cytometric analysis of MDM infected with replication-competent HIV-1-BAL-HAS (A) and HIV-1ΔEnv-GFP/VSVG (B). The numbers in each graph in the top panel indicate the percentage of events falling within the CD24-positive gate. FSC, forward scatter; APC, allophycocyanin. Data from multiple donors are summarized in the corresponding graph in the bottom panel, with each symbol representing the value for a single donor and mean values from multiple donors provided as a percentage above each condition. Values that are significantly different are indicated by bars and asterisks as follows: **, P ≤ 0.01; ***, P ≤ 0.001; ****, P ≤ 0.0001. Independent one-sample t tests were used to determine significance between each IFN treatment condition to the no-IFN control. (C) Lysates (10 µg) from MDM from representative donors (A031 and A049) were analyzed by Western blotting for pSAMHD1-T592, total SAMHD1, and β-actin. Values below each lane indicate the ratio of pSAMHD1 to total SAMHD1 as determined by densitometry. (D) Correlation between pSAMHD1-T592 and percent GFP-positive or (E) total SAMHD1 and percent GFP-positive MDM for donor A031 (circles) and donor A049 (squares). Each symbol represents the mean percentage of infection from triplicate wells as measured by flow cytometry plotted against the ratios determined by Western blotting densitometry, as calculated in Fig. 1C.

