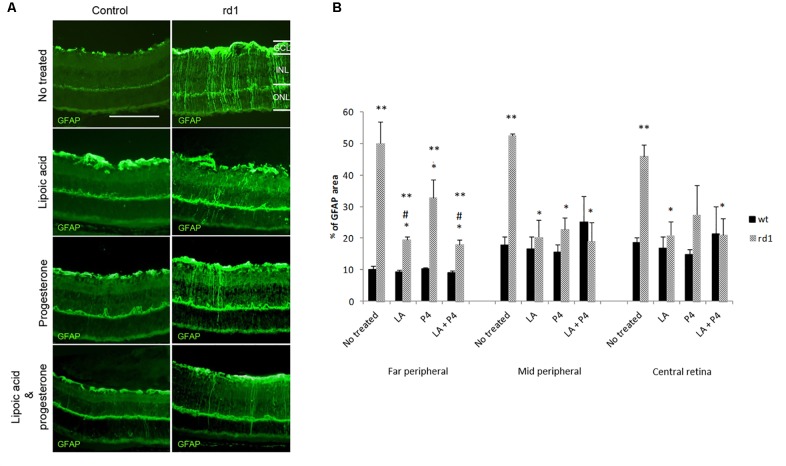
FIGURE 2.
GFAP retinal immunostaining. (A) Examples of images of fluorescent labeling for GFAP in central retinas from non-treated, treated with LA, treated with progesterone and treated with LA and progesterone rd1 mice (images on the left corresponds to control mice and images on the right corresponds to rd1 mice) (Scale bar: 50 μm). (B) Histogram comparing GFAP (% stained area) in retinas non-treated, treated with LA, treated with progesterone and treated with LA and progesterone rd1 mice (three animals for strain and treatment; ∗∗p < 0.02 vs. control mice, ∗p < 0.02 vs. non-treated rd1; #p < 0.05 vs. P4 treated rd1 mice).

