
Fig. 3.
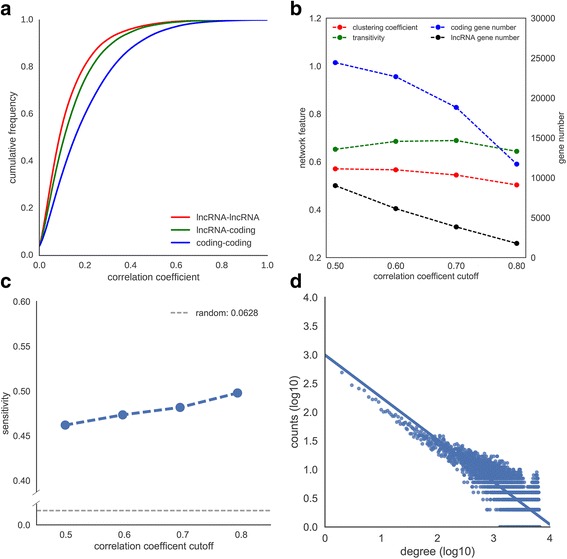
Features of zebrafish coding-lncRNA gene co-expression network. a Cumulative distribution of gene expression Spearman’s correlation coefficient. b Network statistics by different correlation coefficient cutoffs. c Evaluation of function prediction performance of the network with different cutoffs. d Network degree distribution (correlation coefficient cutoff = 0.5)