
Fig. 5.
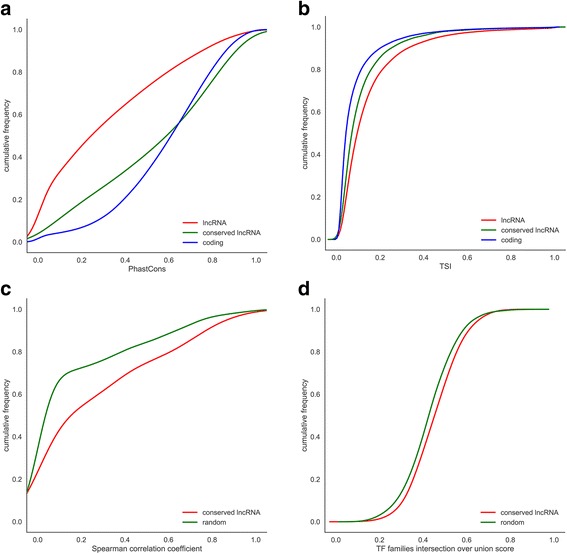
Conservation analysis of zebrafish lncRNAs. a Cumulative distribution of conservation levels computed using PhastCons applied to the 8-way whole-genome. b Cumulative distribution of TSI (tissue specificity index). c Cumulative distribution of Spearman’s correlation coefficient of gene expression. d Cumulative distribution of TF families’ intersection over union score