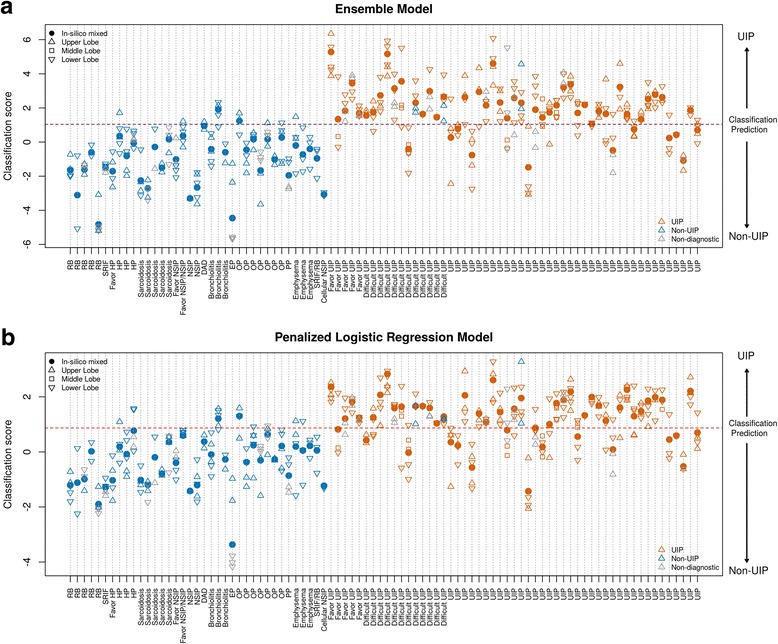
Fig. 4.

Cross-validated classification scores for the two candidate models. Classification scores of (a) Ensemble Model and (b) Penalized Logistic Regression Model from leave one patient out (LOPO) cross validation. Red, blue and gray indicate samples with histopathology UIP, non-UIP, and non-diagnostic respectively. Circle, up-pointing triangle, square and down-pointing triangle indicate in silico mixed sample, upper, middle and lower lobe samples respectively. Each vertical line represents one distinct patient; all the points on the same line are the multiple samples from the same patient. The X-axis is the patient-specific pathology label where non-UIP patients are on the left and UIP patients are on the right. The Y-axis is the cross-validated classification score. The purple horizontal dash line is the prospectively defined classifier decision boundary. Scores above the decision boundary is predicted as UIP and scores below or equal to the decision boundary is predicted as non-UIP
