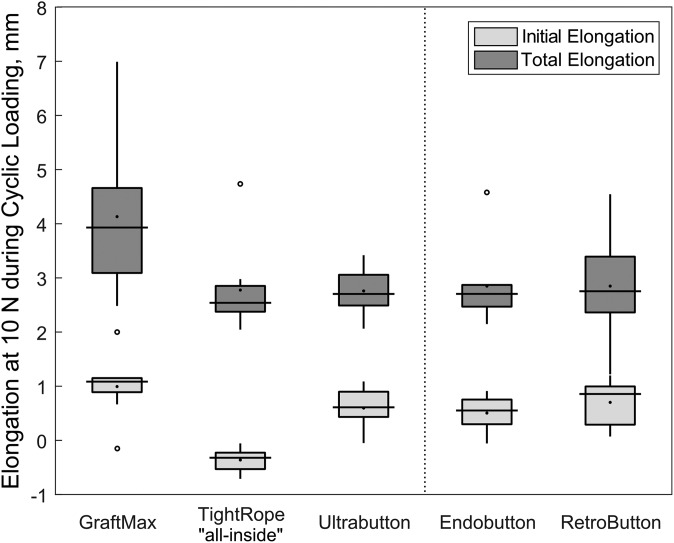
Figure 6.
Box-and-whisker plot depicting initial and total elongation for each device. The initial elongation was measured as the valley elongation from the start of testing until the first cycle of the force control block was completed. The total elongation is the sum of initial and dynamic elongation. Values are presented as median (line), interquartile range (box), and 95% CI (vertical lines). Black points and circles indicate mean values and outliers, respectively.

