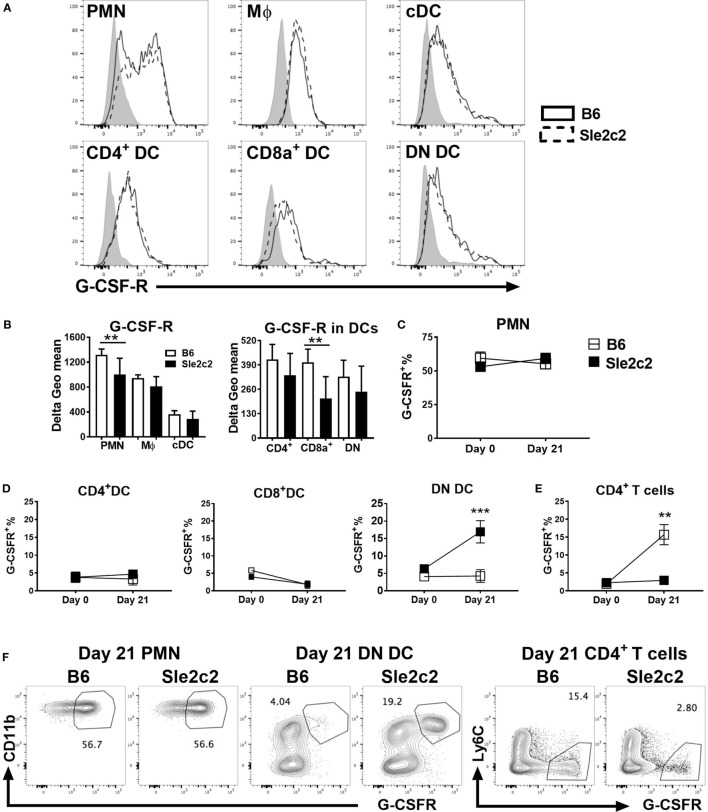
Figure 3.
B6.Sle2c2 mice express lower levels of G-CSF-R on polymorphonuclear neutrophils (PMNs) and dendritic cells (DCs). (A) Representative histogram overlays showing G-CSF-R expression on splenic PMNs, macrophages (Mϕ), conventional DCs (cDCs), and CD4+, CD8α+, and DN DC subsets from B6 (plain) and B6.Sle2c2 (dashed) mice at steady state with the control shown in gray. (B) G-CSF-R expression (delta geometric mean) on myeloid cell subsets. Percentage of G-CSFRhi cells among PMNs (C), CD4+, CD8α+, and DN DCs (D), as well as CD4+ T cells (E) from B6 (open square) and B6.Sle2c2 (black-squares) mice at days 0 and 21 after chronic graft-versus-host disease (cGVHD) induction. (F) Representative FACS dot plots showing G-CSF-Rhi population within splenic PMNs, DN DCs and CD4+ T cells at day 21 post-cGVHD induction (N > 3 per subset and strain, **p < 0.01, ***p < 0.001).

