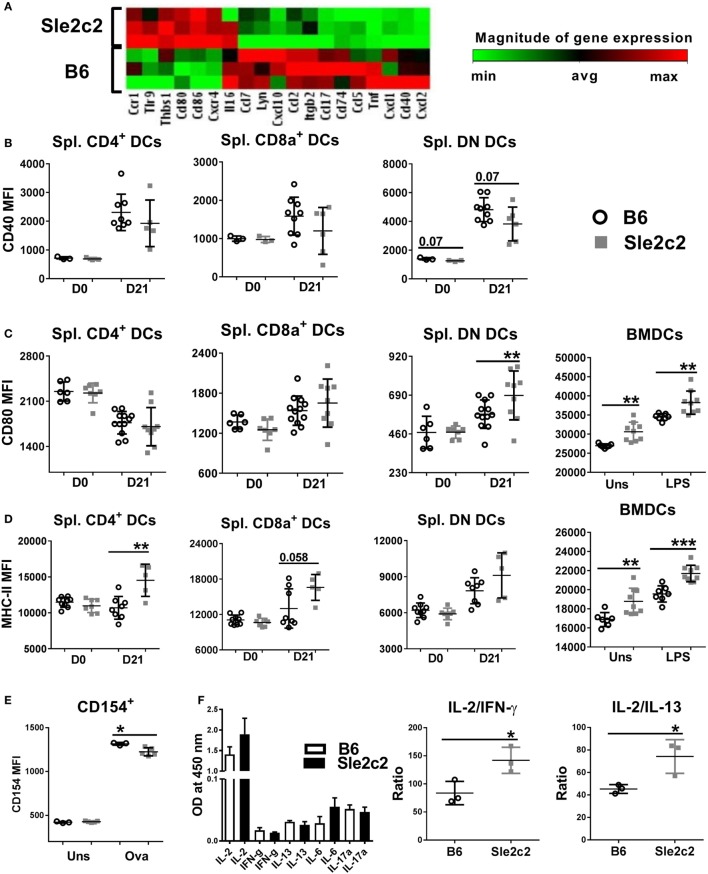
Figure 6.
B6.Sle2c2 bone marrow-derived DCs (BMDCs) display a less inflammatory gene expression signature than B6 BMDCs. (A) Differential gene expression of B6 and B6.Sle2c2 BMDCs stimulated with 1 µg/ml LPS for 24 h (N = 3). CD40 (B), CD80 (C), and MHC-II (D) protein expression on unstimulated and LPS-stimulated BMDCs and the three splenic dendritic cell (DC) subsets from B6 and B6.Sle2c2 mice before and after chronic graft-versus-host disease induction. (E) CD154 expression on OT-II cells cocultured with BMDCs with or without OVA peptide for 72 h. (F) Cytokine levels in the supernatants of the cocultures, assessed by multi-analyte ELISA. The two graphs on the right show the relative ratios of IL-2 to IFNγ and IL-13 (N = 3–8, *p < 0.05; **p < 0.01).

