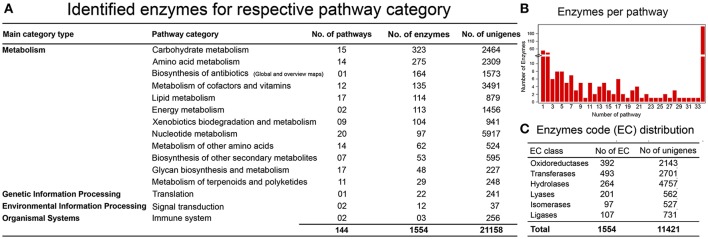
Figure 4.
KEGG Pathway analysis. (A) Identification of genes encoding enzymes in 15 functional pathways among four main categories. (B) Distribution of enzymes per pathway, X-axis shows the number of pathways, while Y-axis represents the number of identified enzymes for each pathway. (C) Enzyme code distribution according to the enzyme class (EC) type.

