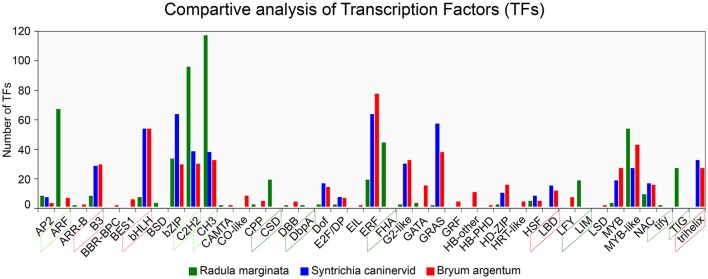
Figure 7.
Comparative analysis of Transcription Factor families from Radula marginata and related moss species. TF families are on X-axis while number of TFs for each family shown on Y-axis. Green dotted box represents abundant TF families; those in red dotted box are less abundant, green solid-line box is for TF families that are exclusively observed in R. marginata compared with related moss species, while red solid-line box represents TF families that were not observed in R. marginata.

