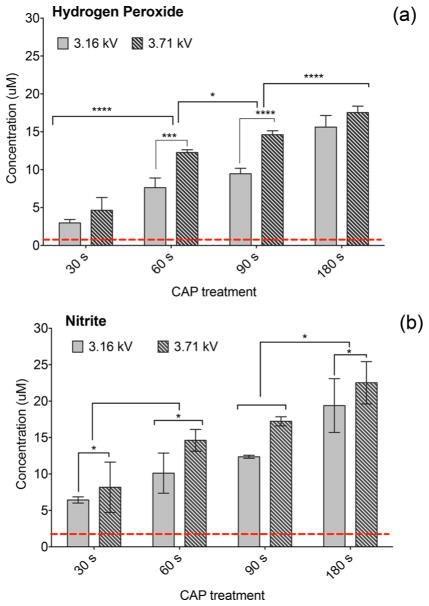
Figure 3.
Levels of H2O2 and NO2− in cell culture media (no cells) immediately after CAP exposure. Concentration of CAP-generated H2O2 (a) and NO2− (b) was measured in cell culture media for CAP exposures of 30, 60, 90, and 180 s with 3.16 or 3.71 kV. Levels of CAP-generated H2O2 and NO2− rise with the increasing discharge voltage and exposure time. The lowest detection limit indicated by the dotted line is the amount of H2O2 and NO2− in untreated cell culture media.

