Figure 7.
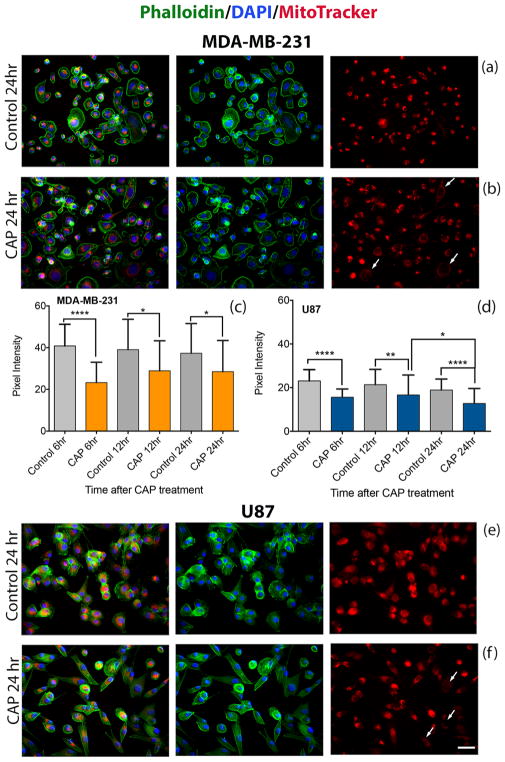
CAP exposure reduces the mitochondrial membrane potential in cancer cells. Immunofluorescence staining of actin (phalloidin) green, nucleus (DAPI) blue, and MitoTracker Red of breast cancer MDA-MB-231 cells (a,b) and glioblastoma U87 cells (e,f) at 24 h. Subcellular distribution of MitoTracker Red was revealed by confocal microscopy. The white arrows in (b,f) point to cells exhibiting a decrease in the red pixel intensity, which is indicative of a loss in mitochondrial membrane potential. Pixel intensity values of 50 cells (two frames per experiment) reveal the distribution of mitochondrial membrane potentials at 6, 12, and 24 h after CAP exposure (c,d); scale bar (bottom image): 10 μm.

