
Fig. 1.
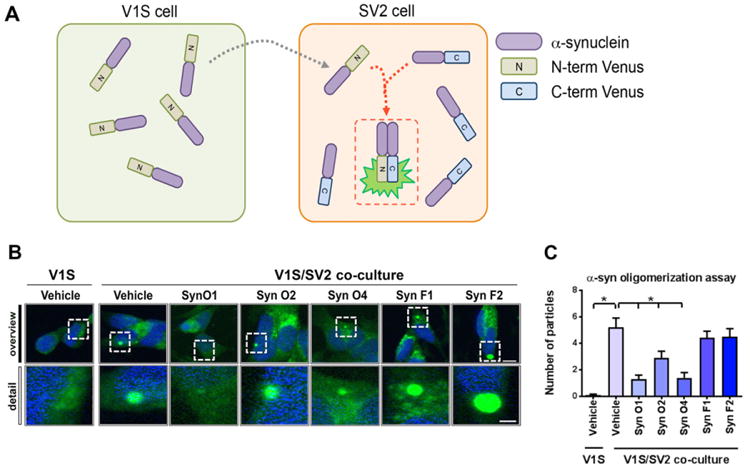
In vitro testing of the differential ability of the α-syn antibodies at blocking oligomerization in a cell-based fluorescent complementation assay. (A) Schematic diagram of cell-based a-synuclein oligomerization monitoring assay. The assay consists with two different SH-SY5Y cell lines expressing N-terminal venus (V1S) or C-terminal venus (SV2) conjugated a-synuclein, respectively. To visualize fluorescence complementation, V1S and SV2 cells were co-cultured for 3 days. (B) Representative images were taken from SV2 cells after a 3-day co-culture in the presence of various α-synuclein antibodies. (C) Quantification of the average numbers of fluorescence particles was analyzed in SV2 cells. Scale bar upper panel = 10 μm; lower panel = 5 μm.*= p-value < 0.05 using One-way ANOVA followed by Dunnett's multiple comparisons post hoc test comparing each group with vehicle-treated α-syntg mice.