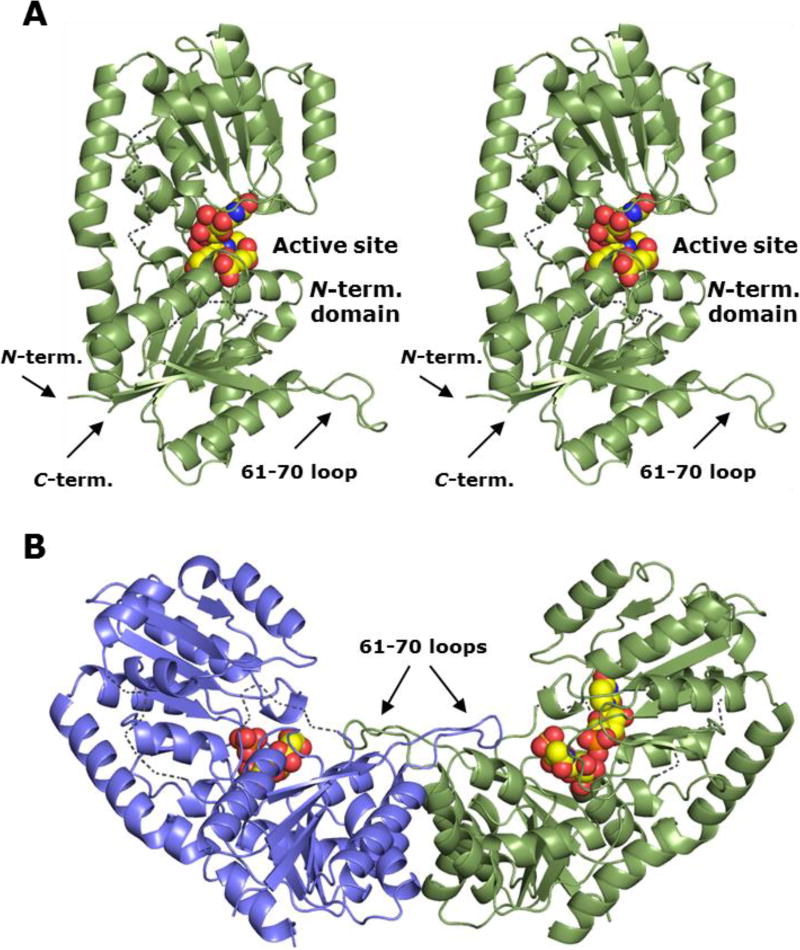
Figure 1. Overall structure of the B. subtilis BshA enzyme.
(A) Cartoon representation of the BshA monomer shown in stereo. Bound ligands are shown as spheres. The locations of the 61–70 loop and the N- and C-termini are indicated with arrows. Estimated positions of the disordered regions consisting of residues 44–48 and 178–184 are shown by dashed lines. (B) Cartoon representation of the BshA dimeric assembly in the closed conformation, colored by chain. The product molecules are shown in spheres. Macromolecular graphics of X-ray crystallographic structures were prepared using PyMOL.46

