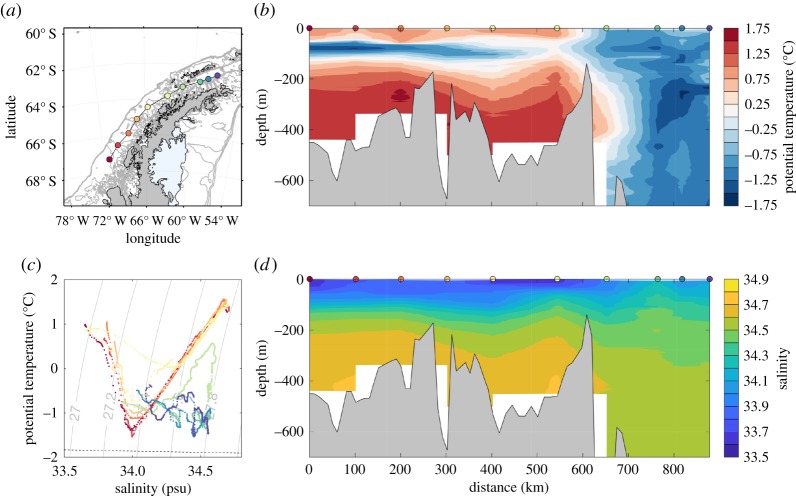
Figure 3.
Hydrographic structure along the WAP shelf from selected stations collected in Austral summer 1998 (Dec 1997–Mar 1998). Panel (c) shows a θ–S diagram (colour coded by distance along the section), and (d) the corresponding vertical sections of potential temperature and salinity. Data obtained from the World Ocean Database 2013 [34].

