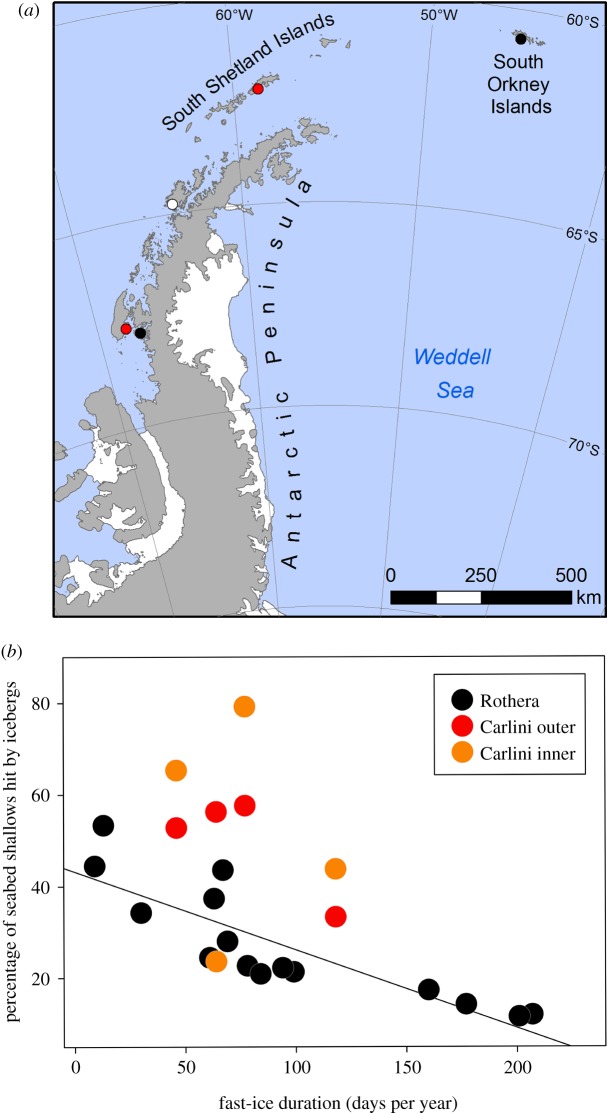
Figure 1.
Monitoring sea ice and iceberg activity in West Antarctica. (a) Monitoring sites, using automated cameras (black circles) and manual observations (white circle), of sea-ice extent in time and space. Monitoring sites of both sea-ice extent and annual iceberg scouring (red circles) at Rothera (bottom red circle) and Carlini (top red circle) [9,21]. (b) Relationship between duration of fast-ice cover each year and ice scouring on the seabed at Rothera and Carlini (inner bay in orange, outer bay in red) stations. The y-axis shows the proportion of the monitored seabed from a 5–25 m depth hit by icebergs. Pearson's correlation line (−0.86, p < 0.001) drawn through Rothera data only.

