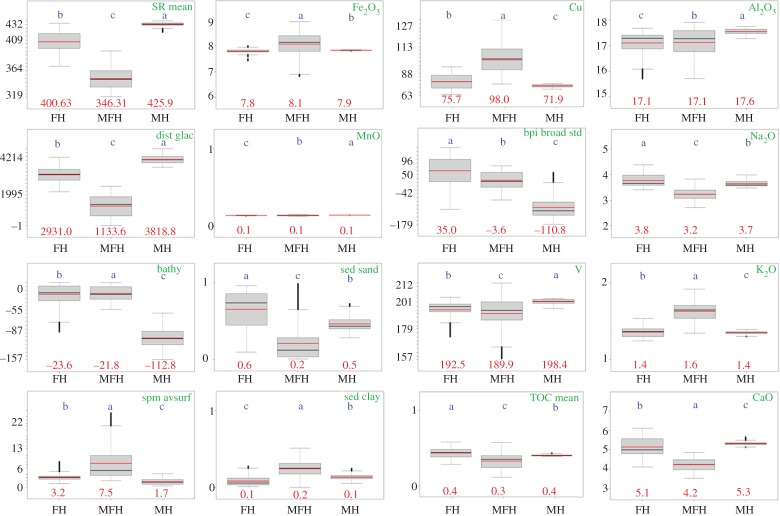
Figure 6.
Data distribution (skewness, spread and outlying points) of selected variables within the habitats according to the probability of mean differences (ANOVA, α-level 0.5) and pair-wise confidence level from Tukey's HSD (95%). Black and red lines are the median and mean values. Red numbers are the mean values; the order of the blue letters represents the degree of similarity between the habitats. Habitats assigned to the same letter would not be significantly different. For the location of the habitats, refer to figure 4d. For variable units, refer to table 1.

