Figure 1.

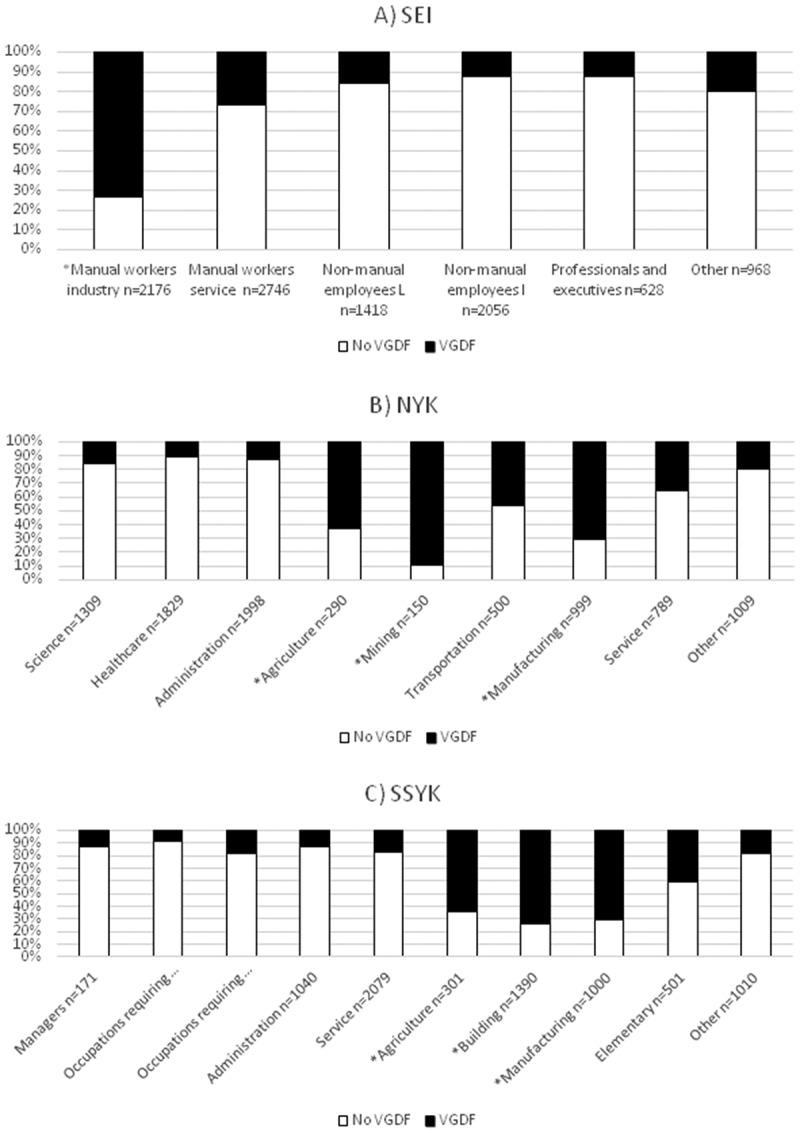
Proportion (%) reporting exposure to VGDF in the socioeconomic (A) and occupational (B, C) groups. * = a significant difference in proportion reporting VGDF in the specific group compared to all other groups.

Proportion (%) reporting exposure to VGDF in the socioeconomic (A) and occupational (B, C) groups. * = a significant difference in proportion reporting VGDF in the specific group compared to all other groups.