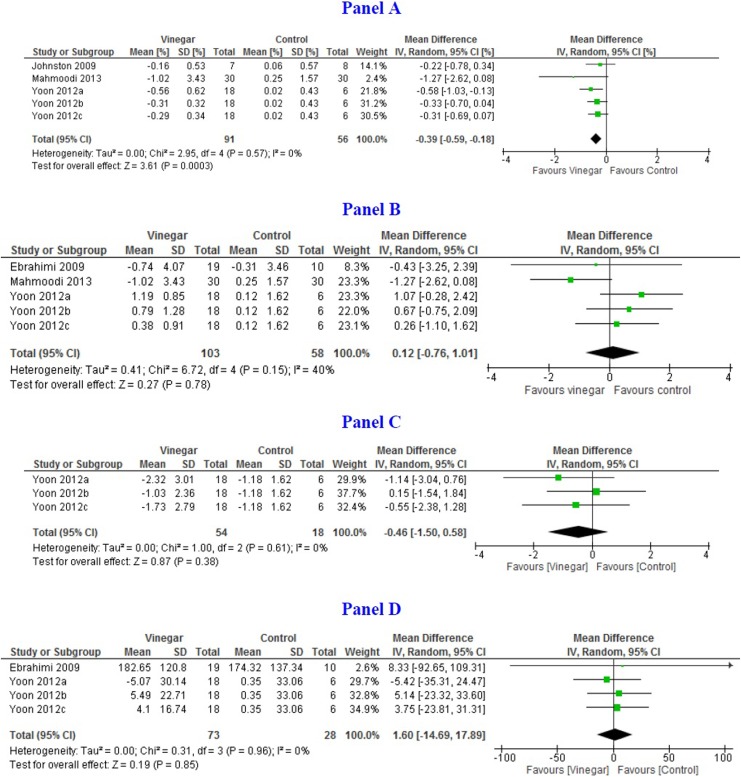
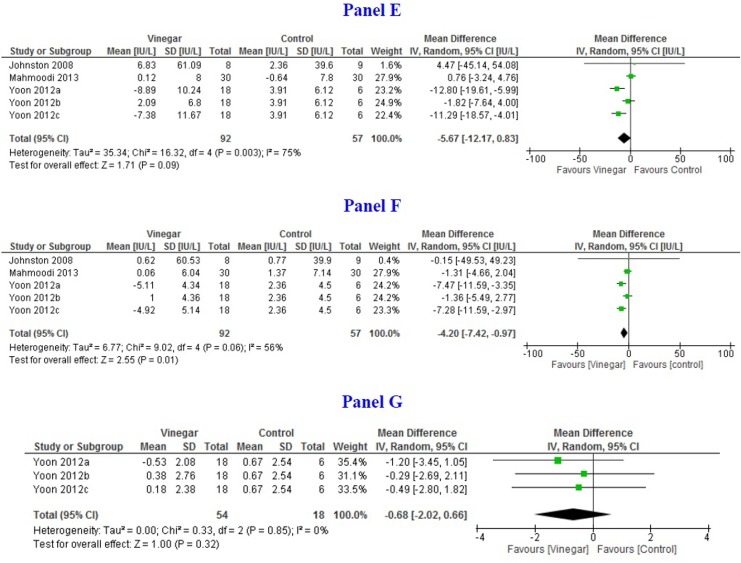
Figure 3.
Forest plots depicting pooled estimates for the long-term outcomes and adverse effects comparing means of the vinegar and control groups. (Panel A) Hba1C% at 8 to 12 weeks; (Panel B) Fasting plasma glucose (mmol/L); (Panel C) Postprandial blood glucose (mmol/L); (Panel D) Plasma insulin (pmol/L); (Panel E) Alanine aminotransferase at 12 weeks (IU/L); (Panel F) Aspartate aminotransferase (IU/L); and (Panel G) Leptin (pg/mL).


