
Fig. 5.
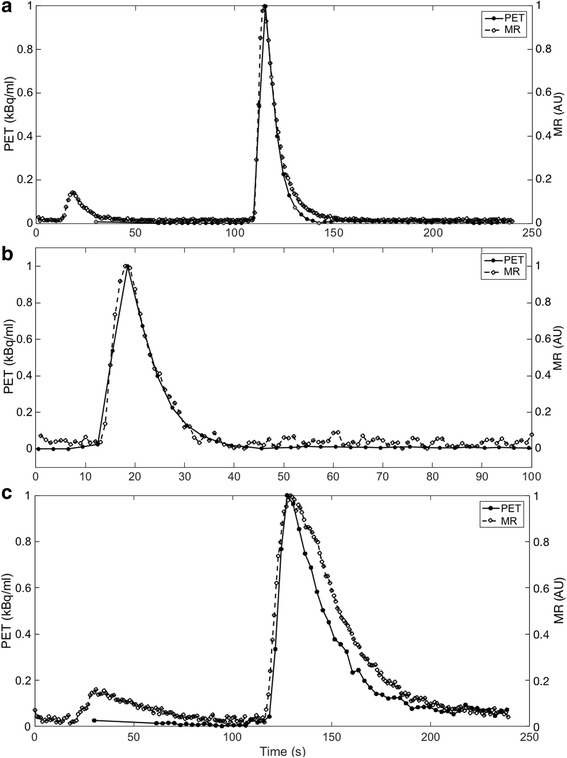
Comparison of normalized (respective maximum signal intensity) AIFs derived from both PET and MR signal traces at a myocardial perfusion rate of 4 ml/g/min and cardiac output of 3 l/min. Image (a) represents the input functions from the main MR bolus and PET bolus, showing a longer washout of GBCA than radiotracer in the main bolus. Image (b) details the MR prebolus with the same PET bolus as (a) but time-shifted to provide comparison. Image (c) details the simultaneous curves from the myocardial compartment showing a clear difference in transit time, potentially due to higher mass and viscosity of the GBCA