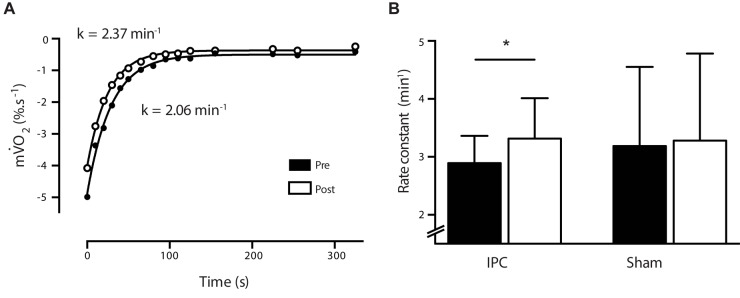
FIGURE 4.
(A) Representative (n = 1) NIRS m O2 recovery curve from pre (white circle) and post (black circle) following a 7-day IPC intervention. Data is fitted to a non-linear monoexponential curve and a rate constant (k) derived. (B) Bar graph illustrates average rate constants for pre (black) and post (white) for the IPC (n = 10) and sham (n = 10) groups. ∗P > 0.05.

