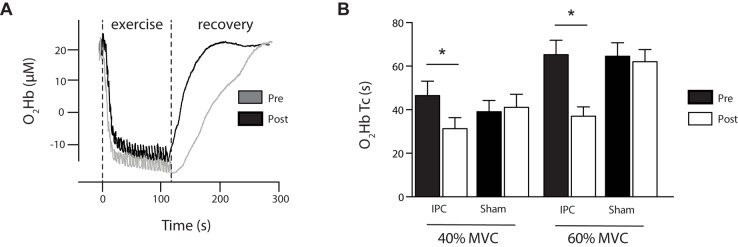
FIGURE 5.
(A) Representative exercise protocol showing submaximal intermittent plantar flexion contractions at 40% 1RM and the subsequent reoxygenation in recovery. Data shown is from NIRS O2Hb and presented as pre (gray) and post (black) 7-day IPC. Note: recovery is faster (P < 0.05) following 7-day IPC. (B) The time constant (Tc) of recovery O2Hb following exercise at 40 and 60% MVC is presented for IPC and Sham as pre (black) post (white). ∗P > 0.05.

