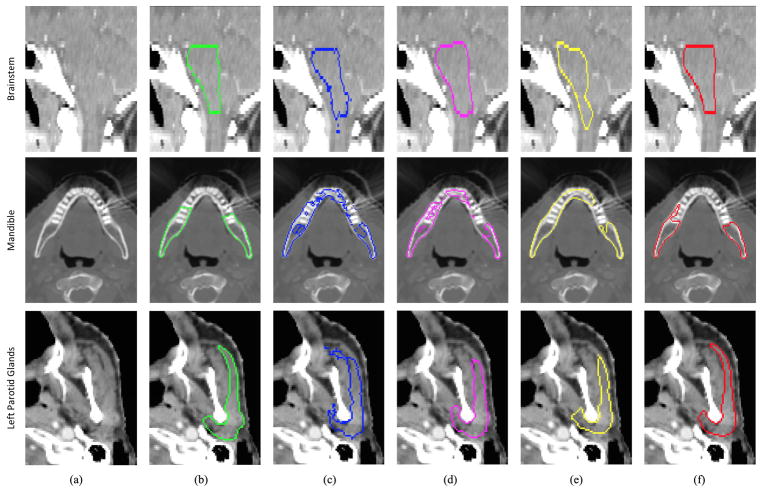
Fig. 10.
Visual comparison of performances of different segmentation methods. The first row shows a sagittal CT slice of the brainstem. The second row shows an axial slice of the mandible. The third row shows an axial slice of the left parotid gland. The six columns in each row show the original CT slice and five segmentation results (in contours) overlaid on the original CT slice. Contours with different colors denote the results of different methods: green -ground truth; blue - appearance based method; pink - conventional shape model method [19]; yellow – equal vertex regression based method; red - proposed hierarchical vertex regression based method.

