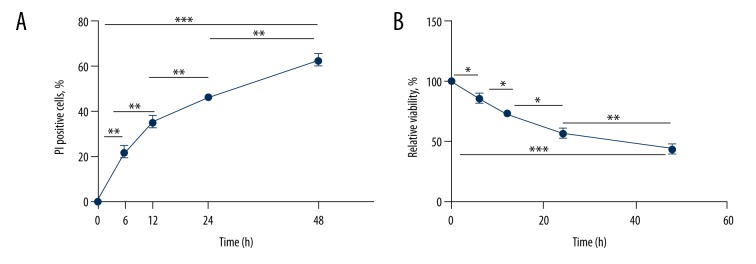
Figure 1.
Analyses of cell apoptosis and viability in SH-SY5Y cells after exposure to OGD condition at different time points (0 h, 6 h, 12 h, 24 h, and 48 h). (A) Percentage of PI-positive cells at different time points in apoptosis assay. With longer duration of OGD treatment, the rate of PI-positive cells exhibited an increasing trend (F=65.666, P<0.001). (B) Relative viability of cells at different time points in MTT assay. The cell viability exhibited an increasing trend with longer duration of OGD treatment (F=69.118, P<0.001). * P<0.05; ** P<0.01; *** P<0.001.

