
Figure 10.
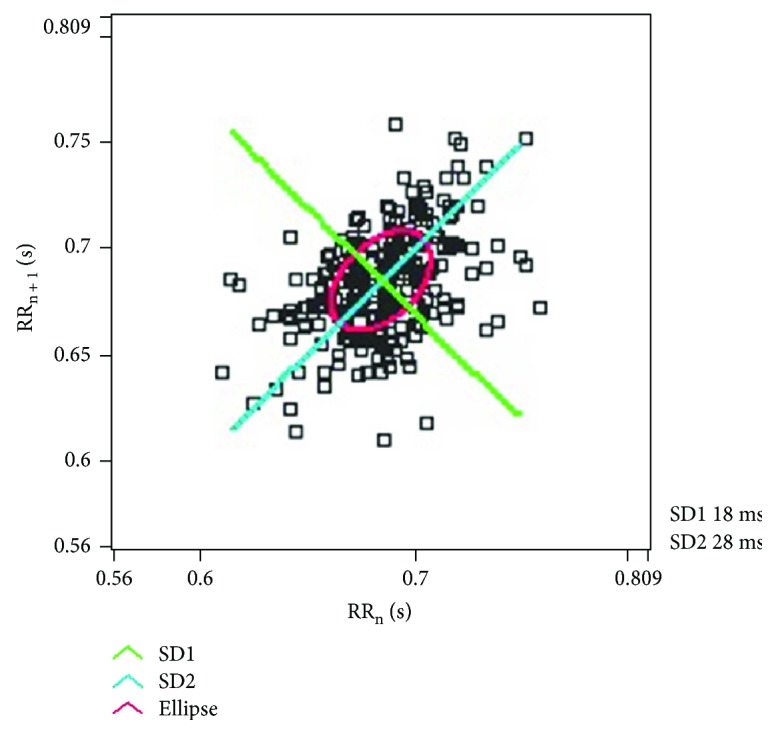
The Poincaré plot of the RRI time series represented in Figure 2. The plot was generated using Biomedical Workbench toolkit of LabVIEW (National Instruments, USA).
Official websites use .gov
A
.gov website belongs to an official
government organization in the United States.
Secure .gov websites use HTTPS
A lock (
) or https:// means you've safely
connected to the .gov website. Share sensitive
information only on official, secure websites.
The Poincaré plot of the RRI time series represented in Figure 2. The plot was generated using Biomedical Workbench toolkit of LabVIEW (National Instruments, USA).