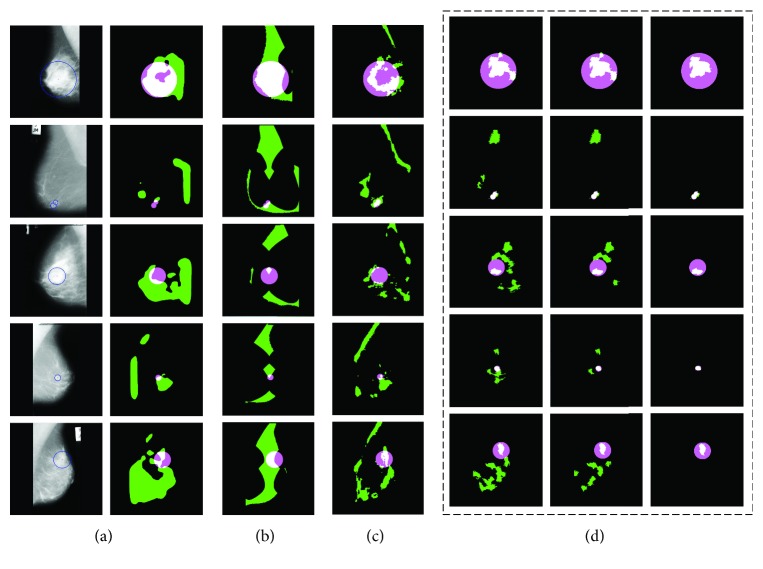
Figure 8.
Sample results of the saliency algorithms. Green denotes the saliency region detected by these algorithms, pink represents the ground truth region containing mass, and white denotes the crossing region between green and pink. (a) Agrawal et al. [16], (b) Achanta and Süsstrunk [55], (c) Murray et al. [56], and (d) the three stages of our method. Stage 1: the fifth column is the detection result of sensation integration. Stage 2: the sixth column is the detection result of semantic integration. Stage 3: the last column is the final detection result (verification) of our method.

