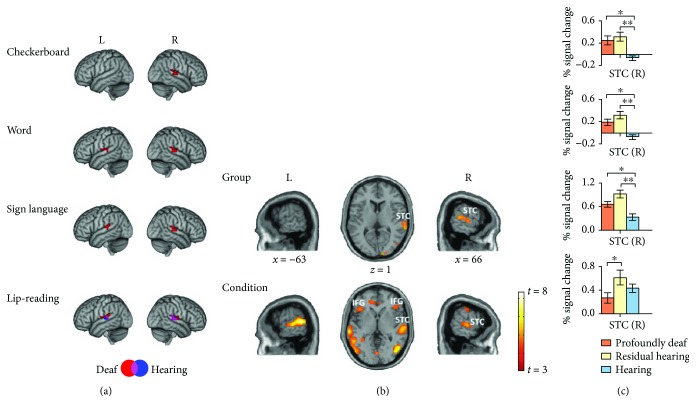
Figure 2.
Activations in the superior temporal cortex in response to visual stimuli. (a) Group-level activities for the four visual stimuli are displayed in MNI (Montreal Neurological Institute) standard space. Lateral views of left and right hemispheres showing activity for the checkerboard, word, sign language, and lip-reading stimuli in deaf (red, including both the profoundly deaf and the residual hearing groups, n = 34) and hearing (blue, n = 15) groups within the brain regions of Brodmann areas (BAs) 41 and 42. The deaf group showed a response to the checkerboard in the right STC region (p < 0.001, FDR p < 0.05 corrected). Bilateral STC activations were found under the word and sign language conditions in deaf subjects (p < 0.001, FDR p < 0.05 corrected). Both the deaf and the hearing groups showed bilateral activations for the lip-reading stimuli (p < 0.001, FDR p < 0.05 corrected). The coordinates and voxel sizes are listed in detail in Table 2. (b) Brain activation to the main effect of Group and Condition are projected on lateral and top views of the brain (t > 3.0, p < 0.001, FDR p < 0.05 corrected). (c) Percent signal change in the regions of interest (10 mm sphere surrounding the peak voxel at in the right STC of the brain map showing the Group effect) of the profoundly deaf (orange, n = 19), residual hearing (yellow, n = 15), and hearing (blue, n = 15) groups. ∗ p < 0.05 (Student's t-test), ∗∗ p < 0.01. Error bars indicate 1 standard error. L: left hemisphere; R: right hemisphere; STC: superior temporal cortex; IFG: inferior frontal gyrus.

