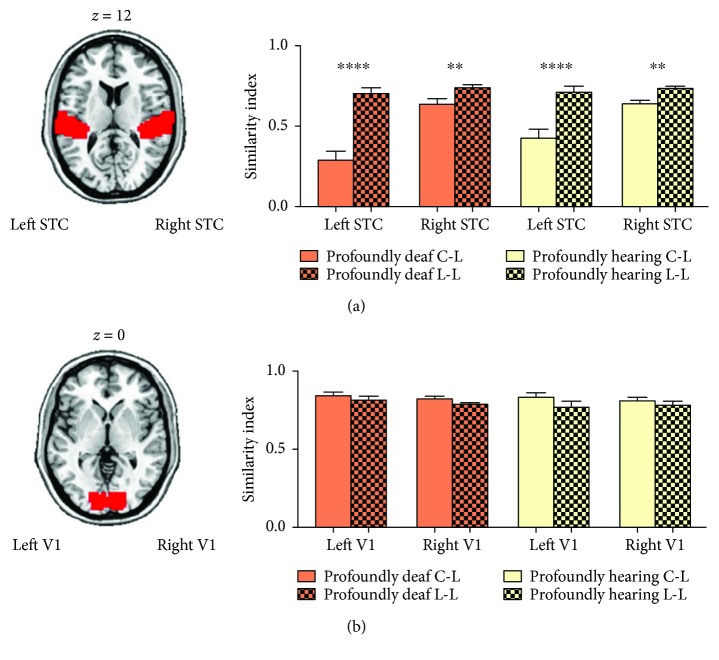
Figure 6.
Representational similarities in activation patterns in the superior temporal cortex (STC) and primary visual cortex. (a) Axial slice depicting the auditory region of interest (ROI; Brodmann areas (BAs) 41 and 42) in red. The bars indicate the similarity (correlation coefficient index) of the spatial activation patterns between visual stimuli within the ROI. The solid bars depict the averaged similarities between checkerboard and language-related stimuli (C-L), including sign language, words, and lip-reading, in both the profoundly deaf group (in orange) and the residual hearing group (in yellow). The grid bars depict the average correlation coefficients between language-related stimuli (L-L). The correlation coefficient between language-related stimuli in the bilateral auditory ROIs was significantly higher than that between checkerboard and language-related stimuli in both the profoundly deaf group (left hemisphere: p < 0.0001, right hemisphere: p < 0.001) and the residual hearing group (left hemisphere: p < 0.0001, right hemisphere: p < 0.0016). (b) Such differences in representational similarity were not observed in the primary visual cortex (V1; BA17). ∗∗ p < 0.01; ∗∗∗∗ p < 0.0001. Error bars represent 1 standard error.

