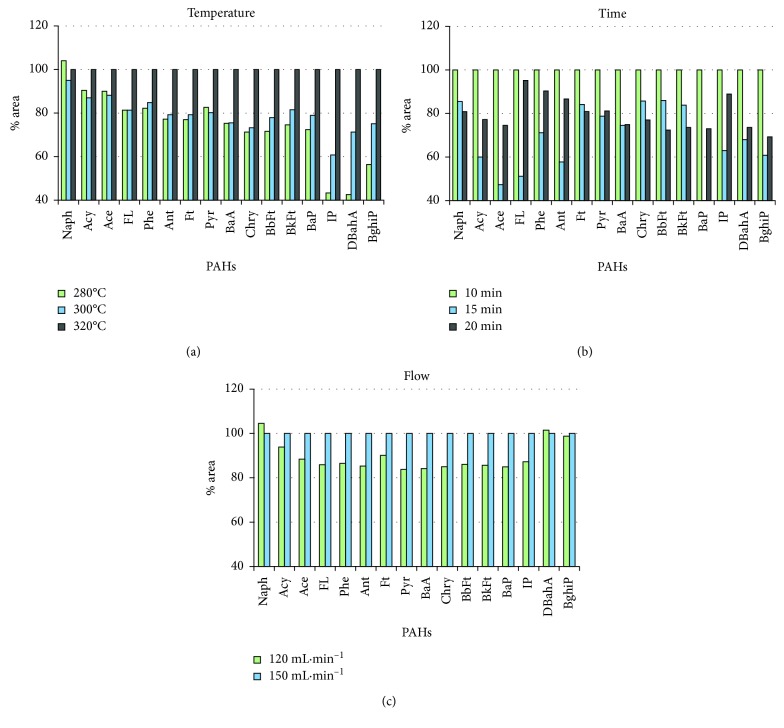
Figure 1.
Area (in %) for each of the 16 EPA PAH obtained in the study of primary desorption conditions (desorption temperature, time, and flow) for sampling tubes (n=5) packed with filter. % Areas at 280°C and 300°C are compared to % areas at 320°C chosen as 100% (a). % Areas at 15 min and 20 min are compared to % areas at 10 min chosen as 100% (b). % Areas at 120 mL·min−1 is compared to % areas at 150 mL·min−1 chosen as 100% (c).

