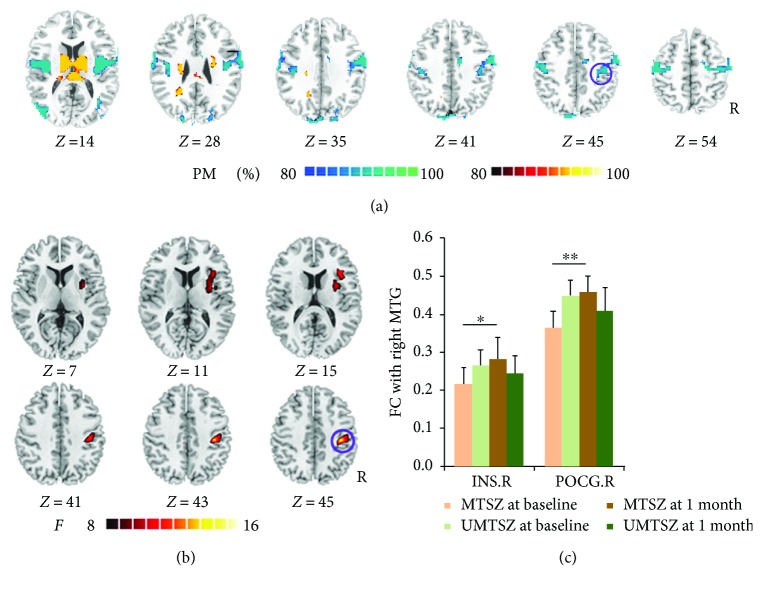
Figure 2.
Music intervention∗time interaction on FC of the right middle temporal gyrus (MTG.R). (a) denotes that the altered FC resulted from seeded-MTG.R FC analysis in patients compared with healthy controls at baseline. The cool color indicates decreased functional connections, and the hot color indicates increased functional connections. All of the maps are shown with a probability score between 80% and 100%. (b) denotes that significant music intervention∗time interaction on FC was observed between the right MTG and right precentral gyrus (POCG.R), as well as the right insula (INS.R). (c) The bar maps present the between-group and within-group differences in regions showing significant music intervention∗time interaction on FC of the MTG.R. The data were expressed as the mean value + standard error. ∗ p < 0.05, ∗∗ p < 0.01. The violet circles mark the same region in (a) and (b), which means the positively modulated region through music therapy in patients.

