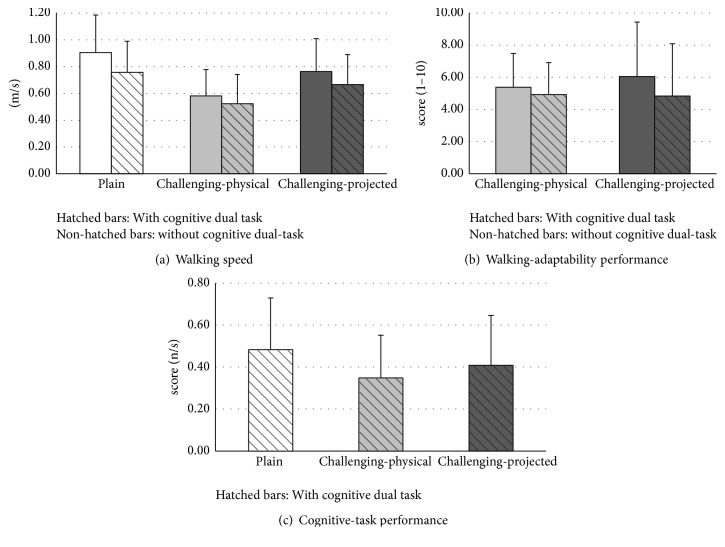
Figure 3.
Representation of walking speed (a) for the six walking conditions (plain, challenging-physical, and challenging-projected, all with and without cognitive task), walking-adaptability performance score (b) for the two challenging walking environment conditions (challenging-physical and challenging-projected, with and without cognitive task), and cognitive-task performance score (c) for the three walking environments (plain, challenging-physical, and challenging-projected). Error bars represent the standard deviations.

