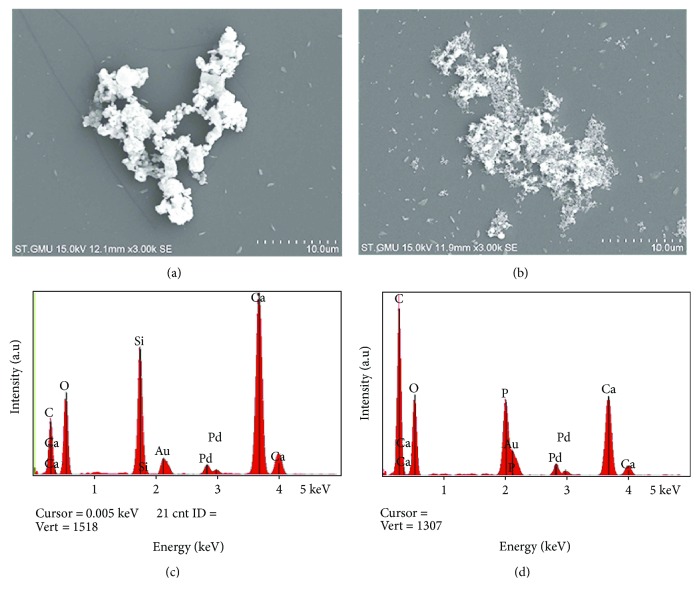
Figure 1.
SEM photographs and EDS analysis of the two biomaterials. SEM shows the surface topography of the C2S and TCP particles (3000x), whereas the EDS analysis shows the elemental composition of the C2S and TCP particles. SEM photographs of (a) C2S and (b) TCP. EDS analyses of (c) C2S and (d) TCP.

