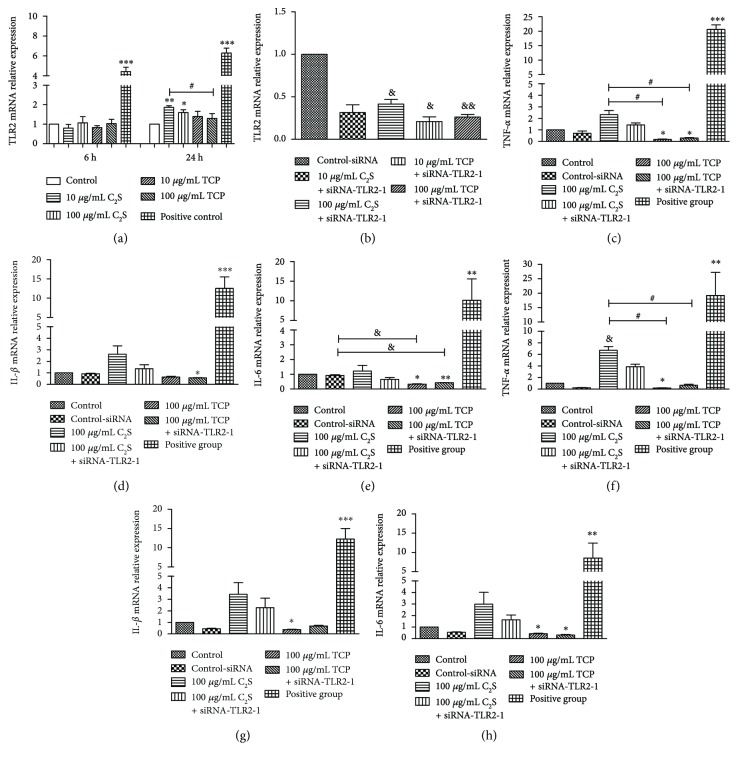
Figure 7.
Relative mRNA gene expression. (a) and (b) represent TLR2 expression after being cocultured with 10 μg/mL and 100 μg/mL C2S or TCP for 6 h and 24 h in RAW 264.7 cells and the relative TLR2 expression after adding siRNA-TLR2-1. After 24 h, the C2S treatment increased the TLR2 expression more than the TCP treatment compared with the control group. Additionally, the TLR2 mRNA expression in the 10 μg/mL C2S group was significantly higher than the 100 μg/mL TCP group (P < 0.05). When we added siRNA-TLR2-1 to these groups, the TLR2 mRNA expression obviously decreased in the 100 μg/mL C2S (P < 0.05), 10 μg/mL TCP (P < 0.05), and 100 μg/mL TCP groups (P < 0.01). (c), (d), (e), (f), (g), and (h) represent the TNF-α, IL-1β, and IL-6 expressions following coculture with 10 μg/mL and 100 μg/mL of C2S and TCP, respectively, in RAW 264.7 cells after 24 h. The 10 μg/mL C2S treatment increased the TNF-α expression to a greater extent than TCP (P < 0.05). After the siRNA-TLR2-1 was added, the expression decreased (e). The 100 μg/mL C2S produced high TNF-α mRNA levels (P < 0.05), which were higher than the 100 μg/mL TCP treatment (P < 0.05) (h). The TNF-α, IL-1β, and IL-6 mRNA expression following the 10 μg/mL and 100 μg/mL TCP treatments were even lower than the control group (c, e, f, g, and h). The positive control group produced an obvious increase in TNF-α, IL-1β, and IL-6 mRNA expressions. The data are expressed as the mean ± SD. ∗P < 0.05, ∗∗P < 0.01, and ∗∗∗P < 0.001 (experimental group versus control). &P < 0.05, &&P < 0.01, and &&&P < 0.001 (experimental group versus control-siRNA). #P < 0.05, ##P < 0.01, and ###P < 0.001 (between the experimental groups).

