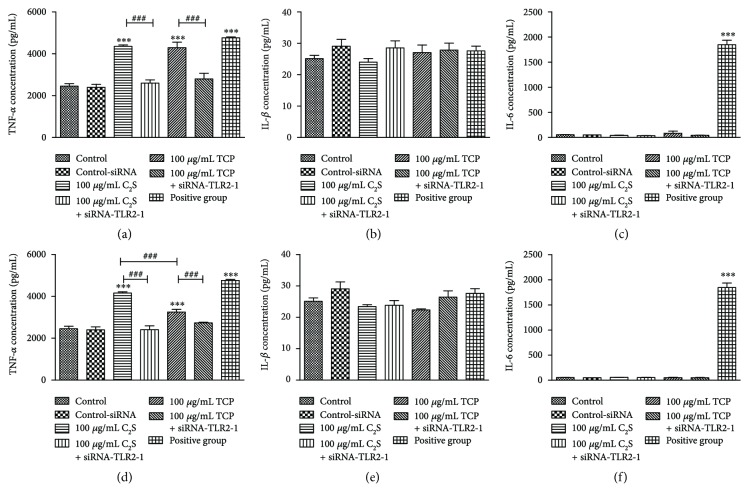
Figure 8.
TNF-α, IL-1β, and IL-6 cytokine concentrations. (a, b, and c) TNF-α, IL-1β, and IL-6 concentrations of the control group, control-siRNA group, 10 μg/mL C2S and TCP particle groups, 10 μg/mL C2S + siRNA-TLR2-1 and TCP + siRNA-TLR2-1 groups, and positive control group. (d, e, and f) TNF-α, IL-1β, and IL-6 concentrations in the groups mentioned above; however, the material concentration was increased to 100 μg/mL. Following incubation for 24 h, the 10 μg/mL and 100 μg/mL C2S and TCP particles produced high TNF-α levels (P < 0.001); however, when we added siRNA, the levels significantly decreased compared with the non-siRNA treated groups (P < 0.001). Moreover, the 100 μg/mL C2S particle group produced more TNF-α than the 100 μg/mL TCP particle group. There were no significant differences in IL-1β and IL-6 concentrations between the experimental groups. The positive control group produced high TNF-α and IL-6 levels (P < 0.001).

