An official website of the United States government
Here's how you know
Official websites use .gov
A
.gov website belongs to an official
government organization in the United States.
Secure .gov websites use HTTPS
A lock (
) or https:// means you've safely
connected to the .gov website. Share sensitive
information only on official, secure websites.
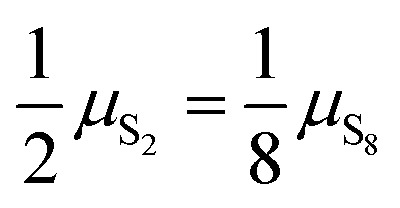
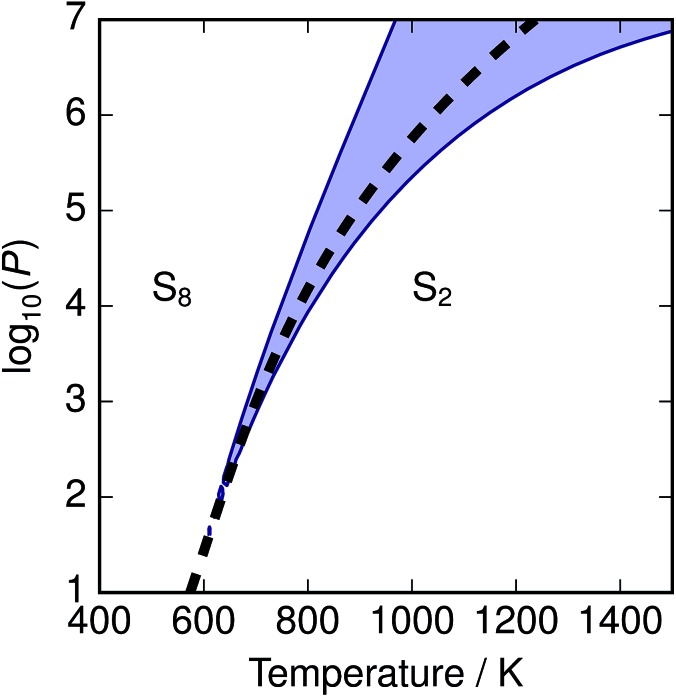
 ; in shaded region the error in chemical potential μ associated with assuming a single phase S2 or S8 exceeds 1 kJ mol–1 S atoms; in unshaded regions the corresponding single-phase free energy is close to the energy of the mixture.