
Figure 1.
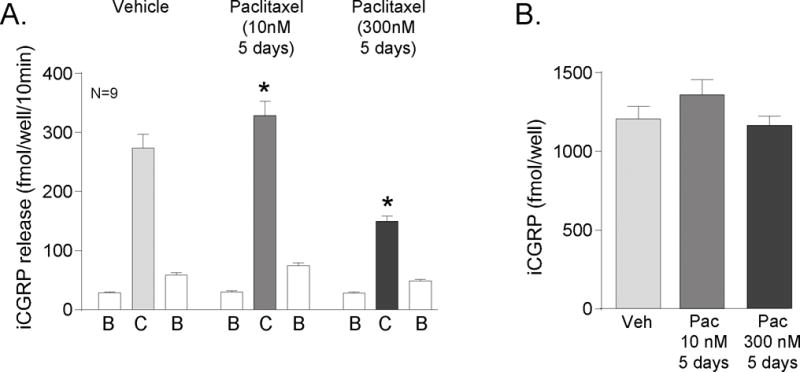
Paclitaxel alters capsaicin-evoked release of CGRP from sensory neurons in culture. A) Each column represents the mean ± SEM of CGRP released in fmol/well/10 min from wells treated with 10 nM or 300 nM paclitaxel for 5 days. The first open column of each group represents basal release (B), the shaded column represents release in the presence of 30 nM capsaicin (C), and the second open column of each group represents the recovery of basal release following stimulation (B). An asterisk indicates a significant difference in capsaicin-evoked release compared to release from the vehicle-treated neurons (p<0.05, N=9) using a two-way ANOVA with Bonferroni’s post-hoc test. B) Each column is the mean ± SEM of total CGRP content in fmol/well (N=9) from vehicle treated cultures (Veh) or paclitaxel treated cultures (Pac) as indicated.