
Extended Data Figure 10. Putative markers for iCM and piCM.
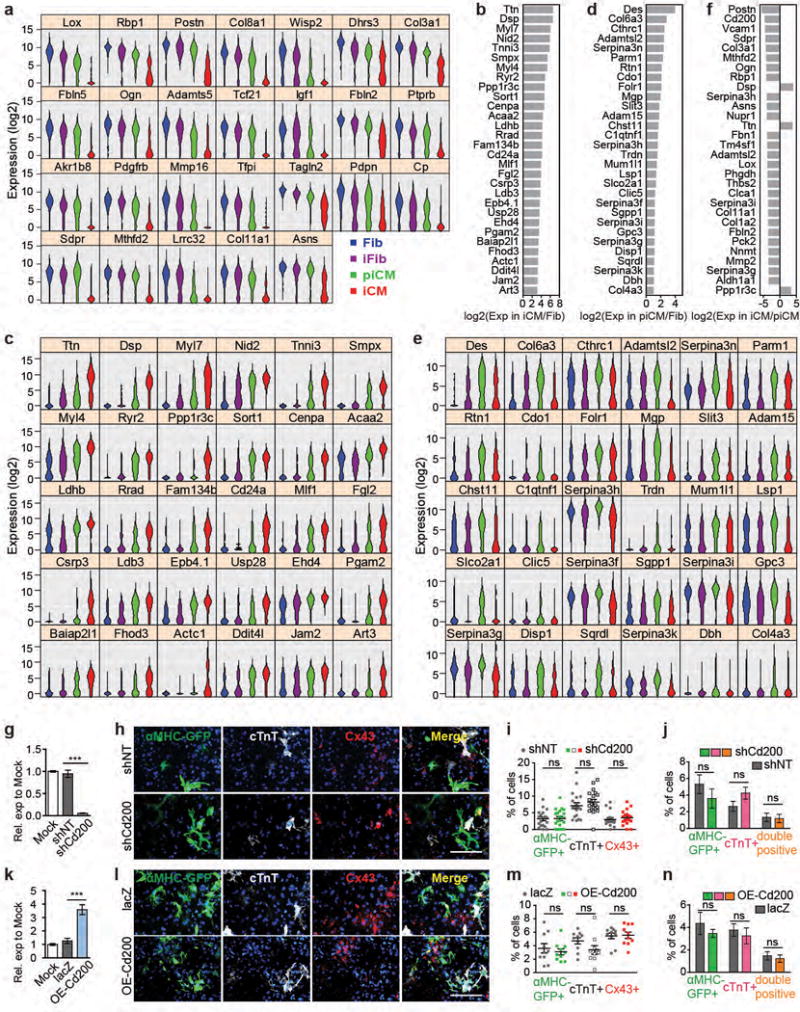
ANOVA identified 7624 DEGs among Fib, iFib, piCM, and iCM. There were 954/285 candidates for negative/positive selection markers of iCM and 55 candidates for positive markers of piCM. These candidates were expressed lowest/highest in iCM and highest in piCM, respectively. No gene passed the selection criteria for negative markers of piCM. Top candidates were selected by largest fold change of expression in the cell population of interest compared to that in Fib. (a) Violin plots showing the expression of non-surface genes in top 30 candidates for negative markers of iCM. Related to Fig. 4d. (b-e) Top 30 candidates for positive selection markers of iCM (b, c) or piCM (d, e). (b, d) Fold change of gene expression in iCM/Fib (b) or piCM/Fib (d). (c, e) Violin plots of the same genes in 4 cell populations. (f) Top 30 genes showing largest expression fold change in piCM and iCM. (g-n) Effect of Cd200 knockdown (g-j) or overexpression (k-n) on iCM reprogramming. CF was untransduced (Mock), or simultaneously transduced with MGT and lentiviral shNT/shCd200 or lacZ/OE-Cd200 for 14 days. Knockdown or overexpression efficiency was verified by qRT-PCR (g, k). Average ± SD was shown. n=3 samples. Percentages of αMHC-GFP+, cTnT+, and Cx43+ cells were determined by immunostaining followed by imaging and blinded quantification (h-i, l-m) with representative 20× images in (h, l). Scale bar = 200 μm. n= 20 (i) or 10 (m) images. Average ± SEM was shown. Percentages of αMHC-GFP+, cTnT+, and double-positive cells were also quantified by flow (j, n). Average ± SD was shown. n=3 samples. Two-sided student’s t test was used. Significance: *** p<0.001, ns, lack of enough evidence for significance.