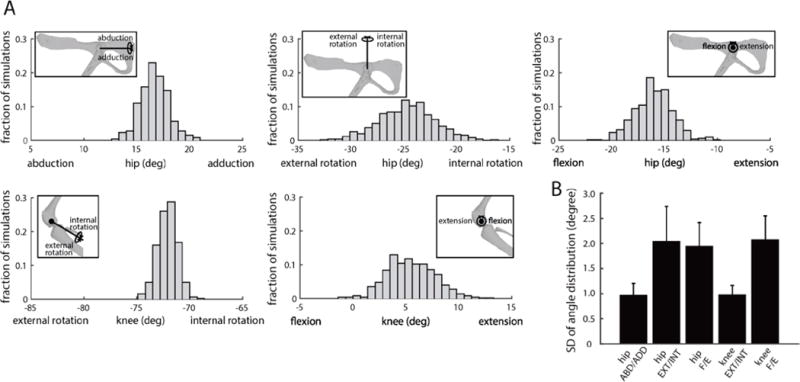
Figure 7.

Uncertainty in joint configuration as a result of uncertainty in bony landmark measurement. The plots show the result of 500 Monte Carlo simulations obtained from registration of model bony landmarks and measured landmarks with variability added as expected by measurement error. (A) shows the results for one limb configuration in one animal. The insets in each figure illustrate the degree of freedom corresponding to each joint angle distribution. (B) shows the standard deviation of the joint angles for each degree of freedom, averaged across animals. In general, the uncertainty in joint configuration was low for all degrees of freedom.
