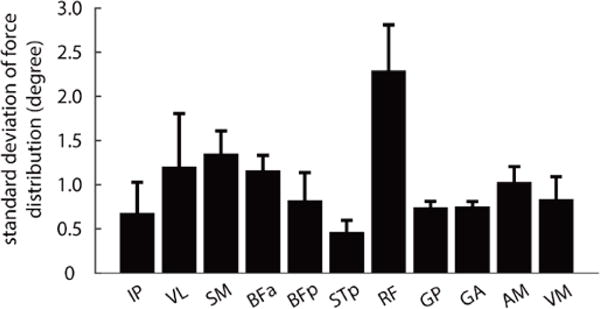
Figure 9.

The standard deviation of the distribution of predicted forces due to uncertainty in estimating limb configuration. Each bar shows the standard deviation of the distribution of predicted force vectors, as illustrated in Figure 8, averaged across limb positions and animals.
