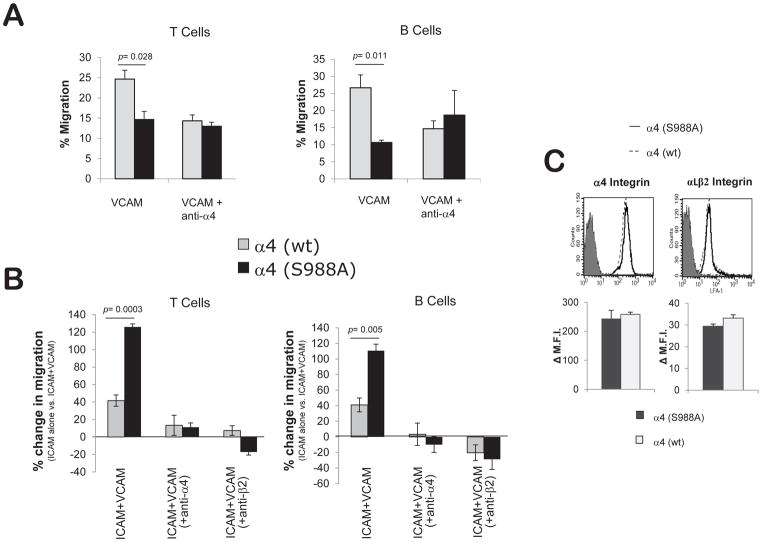
Figure 2.
Increased integrin trans-regulation in α4(S988A) lymphocytes. B and T-cells were purified from spleens of α4(S988A) or control α4(wt) mice. Chemotactic migration towards SDF-1α (15ng/ml) was assessed using a modified Boyden Chamber assay in (A) wells coated with VCAM-1 alone (2 ug/ml), or (B) ICAM-1 (5 ug/ml) +/− VCAM-1 (0.02 ug/ml). For anti-integrin antibody blocking studies, cells were treated with 10μg/ml of either anti-α4 or anti-β2 integrin prior to the assay. Part (B) is the % increase in migration on ICAM-1+VCAM-1 compared to ICAM-1 alone 100*[(ICAM+VCAM migration – ICAM migration)/ICAM migration]. Error bars are S.E.M. of n=4 for each group. (C) Surface integrin expression levels on circulating α4(S988A) T-cells. Blood leukocytes from α4(S988A) and α4(wt) control adult C57BL/6 mice (n=3 per group) were stained with antibodies specific for T-cells (CD3), α4 integrins (CD49d), and αLβ2 integrin heterodimer and analyzed by flow cytometry. Representative histograms show α4 or αLβ2 staining (soild and dotted lines) compared with non-specific isotype control staining (filled peak). Bar graphs summarize staining from n= 3 mice per group; No significant differences were observed. Δ M.F.I = Change in Mean Fluorescence Intensity.

