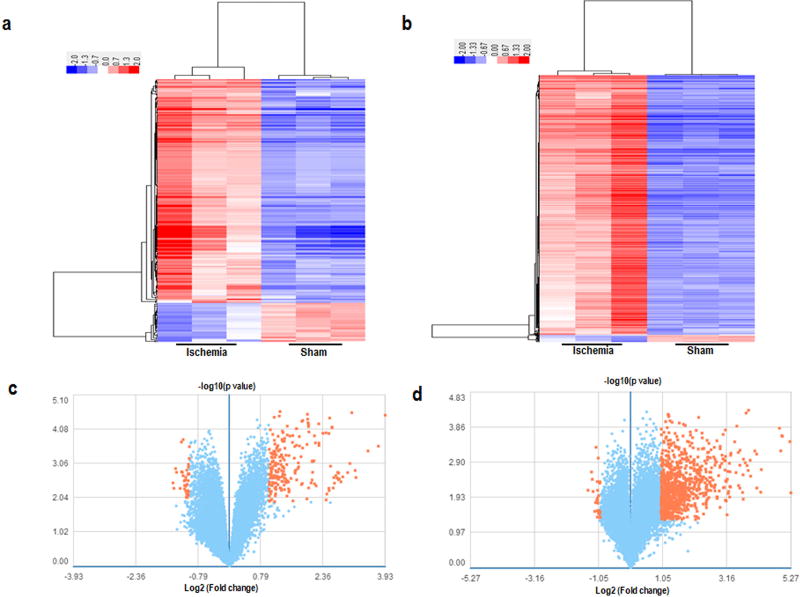
Fig 2. The expression profiles of lncRNAs and mRNAs in mice from the sham and ischemic groups by microarray analysis.
The top row: the hierarchical clusterings show a remarkably differential expression of lncRNAs (a) and mRNAs (b), n=3 per group. Red and green colors represent high and low expression levels, respectively. Each column represents a single group, and each row represents an lncRNA or mRNA. The bottom row: the volcano plots of expression profiles of differentially expressed lncRNAs (c) and mRNAs (d) in mice from the sham and ischemic groups. Orange dots represent genes that passed the statistical and fold-change cutoffs.

