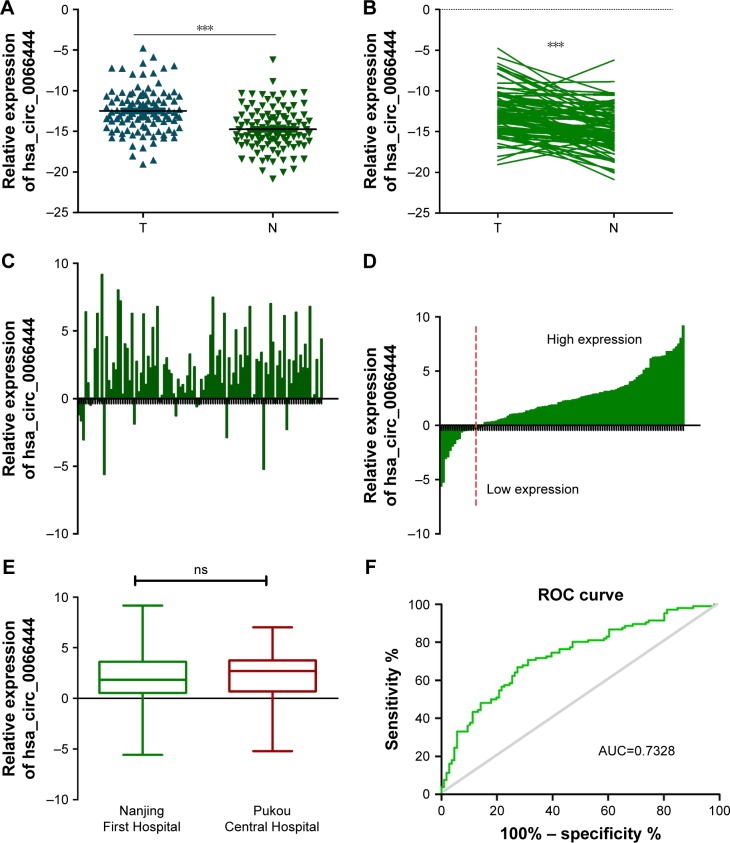
Figure 2.
Relative circ_0066444 expression and its clinical significance in GC tissues.
Notes: (A) The expression of circ_0066444 expression levels was significantly higher than that of adjacent noncancerous tissues from GC patients. The correlation of their −ΔCt value was determined. (B) The expression of circ_0066444 expression levels was significantly higher than that of controls. The correlation of their −ΔCt value was determined. (C) A total of 88 of these cases (83%) exhibited elevated levels of circ_0066444 in tumors. The correlation of their −ΔCt value was determined. (D) The expression levels were divided into high expression and low expression. The correlation of their −ΔCt value was determined. (E) No difference was observed between Nanjing First Hospital and Pukou Central Hospital, Nanjing. (F) The ROC curve has been used to evaluate circ_0066444 potential diagnostic value, the AUC was 0.7328. ***P<0.0001.
Abbreviations: AUC, area under the ROC curve; GC, gastric cancer; ROC, receiver operating characteristic; ns, not significant.

