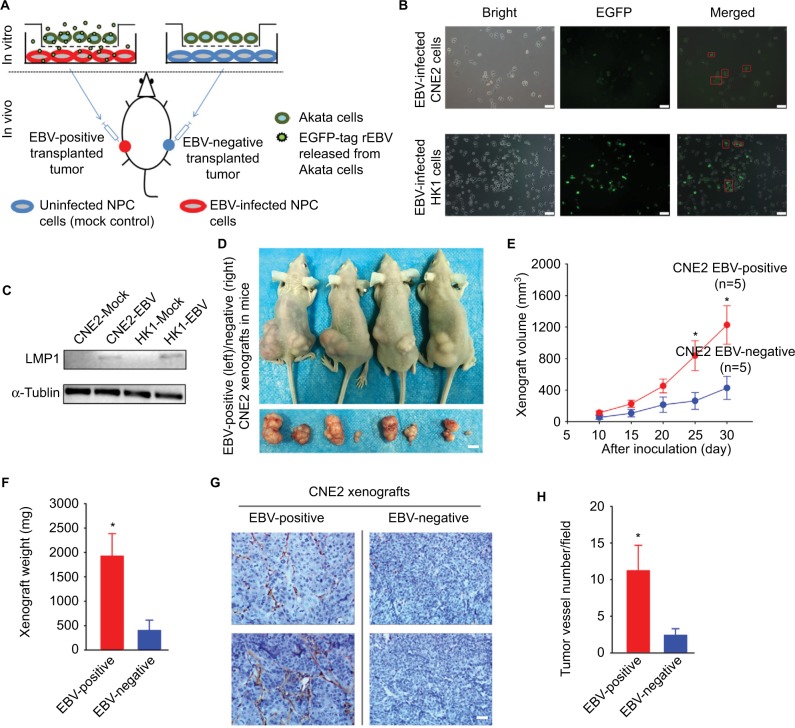
Figure 1.
EBV infection promotes xenograft growth and tumor-associated angiogenesis in vivo.
Notes: (A) The scheme for establishing an EBV-positive/EBV-negative xenograft-bearing mouse model is illustrated. (B) The EGFP-encoding sequence was simultaneously introduced into CNE2 and HK1 cells with the infectious rEBV, which served as a visible indicator for the EBV-positive cells. The red square boxes denote the EGFP-labeled EBV-positive cells that were captured after the co-cultivated EBV infection. Scale bar =50 μm; 200× magnification. (C) After antibiotic resistance-based cell selection, clonal populations of cells were selected by transferring a well-isolated single clump of cells. EBV-encoded LMP1 was detected by western blotting in mock-controlled and EBV-infected CNE2 and HK1 cells. The selected EBV-positive CNE2 and HK1 cells were used for subsequent experiments. (D) Representative photographs of the female BALB/c(nu/nu) mice harboring both EBV-positive (left) and EBV-negative (right) xenografts were captured on Day 30 postinoculation. The dissected xenografts are shown in each bottom panel. Scale bar =10 mm. (E) The xenograft volumes were measured every 5 days from Day 10 postinoculation, when palpable xenografts could be observed (n=5). (F) The EBV-positive and EBV-negative xenografts were isolated from the sacrificed mice on Day 30 and weighed. (G) The representative immunohistochemical analysis of CD31 in the paraffin-embedded xenograft sections. (H) Tumor-associated angiogenesis was quantitatively evaluated by determining the vessel numbers per field. Scale bar =100 μm; 400× magnification. The data are presented as the mean ± SEM (*P<0.05, paired t-test).
Abbreviations: EBV, Epstein–Barr virus; EGFP, enhanced green fluorescent protein; LMP1, latent membrane protein 1; rEBV, recombinant EBV.

