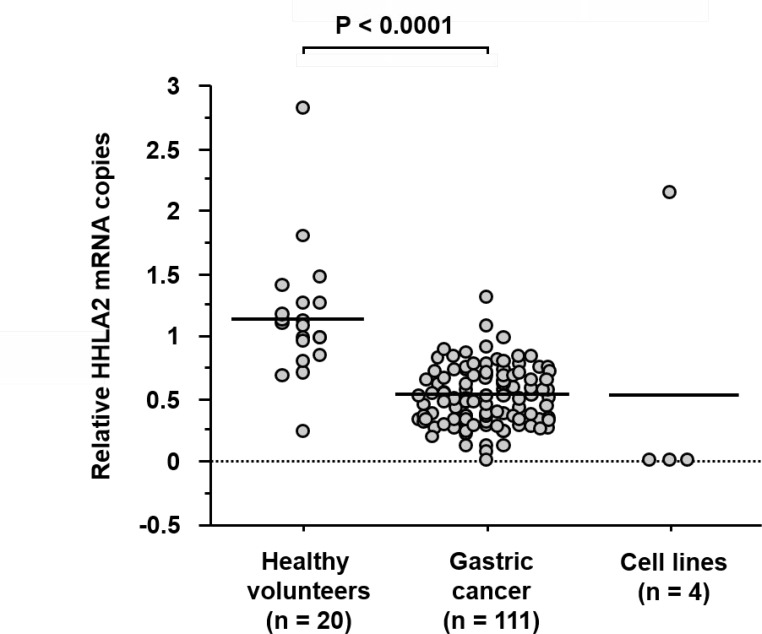
Figure 1. qRT-PCR analysis of HHLA2 mRNA expression levels in blood specimens.
GAPDH was used for normalization and the relative expression levels were analyzed using the 2−ΔΔCT method. HHLA2 mRNA levels were significantly lower in blood specimens obtained from patients with gastric cancer than in PBMC specimens obtained from healthy volunteers (P < 0.0001).

